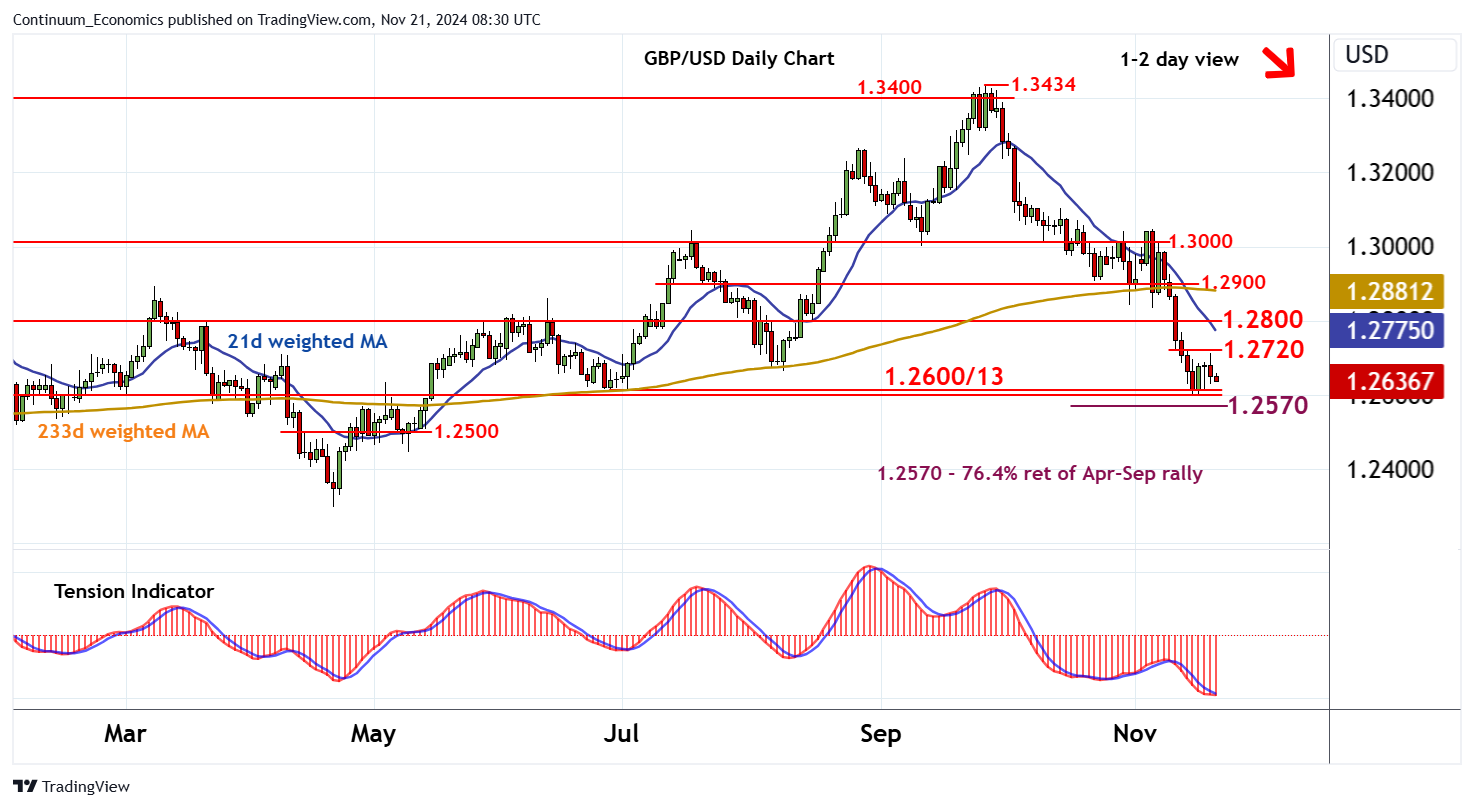
Chart GBP/USD Update: Leaning lower

The anticipated minor test above resistance at the 1.2720 break level has not been seen

| Level | Comment | Level | Comment | |||||
|---|---|---|---|---|---|---|---|---|
| R4 | 1.2900 | * | break level | S1 | 1.2600/13 | * | cong; 27 Jun (m) low | |
| R3 | 1.2800 | * | congestion | S2 | 1.2570 | ** | 76.4% ret of Apr-Sep rally | |
| R2 | 1.2768 | 13 Nov high | S3 | 1.2500 | ** | congestion | ||
| R1 | 1.2720 | break level | S4 | 1.2450 | congestion |
Asterisk denotes strength of level
08:05 GMT - The anticipated minor test above resistance at the 1.2720 break level has not been seen, as cautious trade gives way to a drift lower. Intraday studies are falling and daily readings have turned mixed/negative, highlighting potential for a test of strong support at congestion around 1.2600 and the 1.2613 monthly low of 27 June. A close beneath here would add weight to sentiment and extend September losses towards the 1.2570 Fibonacci retracement. Mixed/negative weekly charts suggest potential for continuation towards congestion around 1.2500. Meanwhile, a break above 1.2720 should meet selling interest beneath congestion resistance at 1.2800.