Published: 2024-11-06T14:46:32.000Z
Chart AUD/USD Update: Choppy trade giving way to consolidation - background studies under pressure

Senior Technical Strategist
-

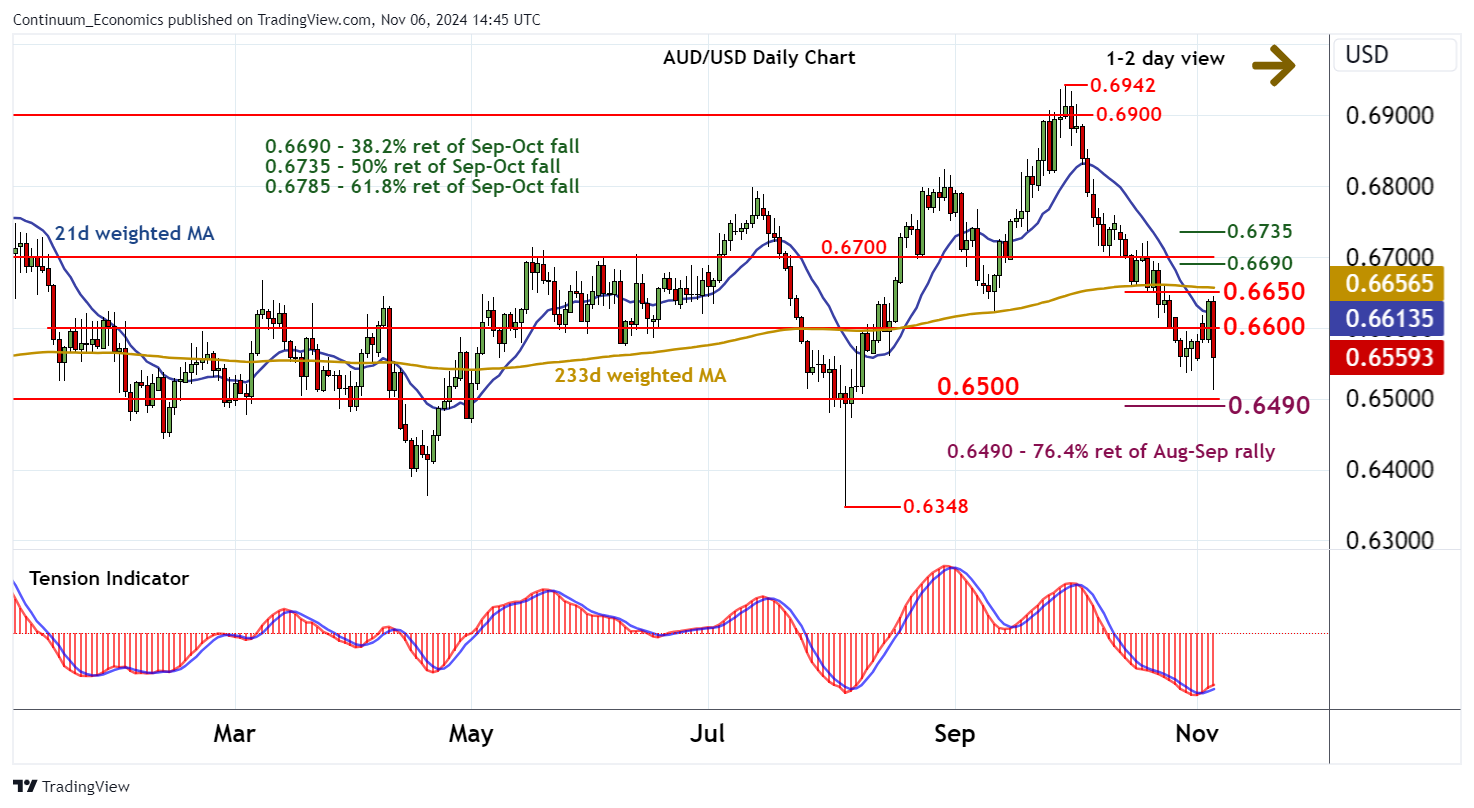
The anticipated test of 0.6650 has given way to sharp losses to 0.6512~

| Levels | Imp | Comment | Levels | Imp | Comment | |||
|---|---|---|---|---|---|---|---|---|
| R4 | 0.6700 | ** | congestion | S1 | 0.6512~ | current day low | ||
| R3 | 0.6690 | ** | 38.2% ret of Sep-Oct fall | S2 | 0.6500 | ** | congestion | |
| R2 | 0.6650 | break level | S3 | 0.6490 | ** | 76.4% ret of Aug-Sep rally | ||
| R1 | 0.6600 | * | congestion | S4 | 0.6472 | 6 Aug low |
Asterisk denotes strength of level
14:30 GMT - The anticipated test of 0.6650 has given way to sharp losses to 0.6512~, before settling into volatile trade around 0.6560. Daily stochastics and the daily Tension Indicator continue to strengthen, suggesting difficulty sustaining any immediate tests lower. But broader weekly charts are bearish, highlighting room for a later break below strong support at the 0.6490 Fibonacci retracement and congestion around 0.6500. A close beneath here will add weight to sentiment and extend September losses towards the 0.6348 current year low of 5 August. Meanwhile, a close back above congestion resistance at 0.6600 will help to stabilise prices and prompt consolidation beneath 0.6650.