Published: 2024-11-06T17:39:59.000Z
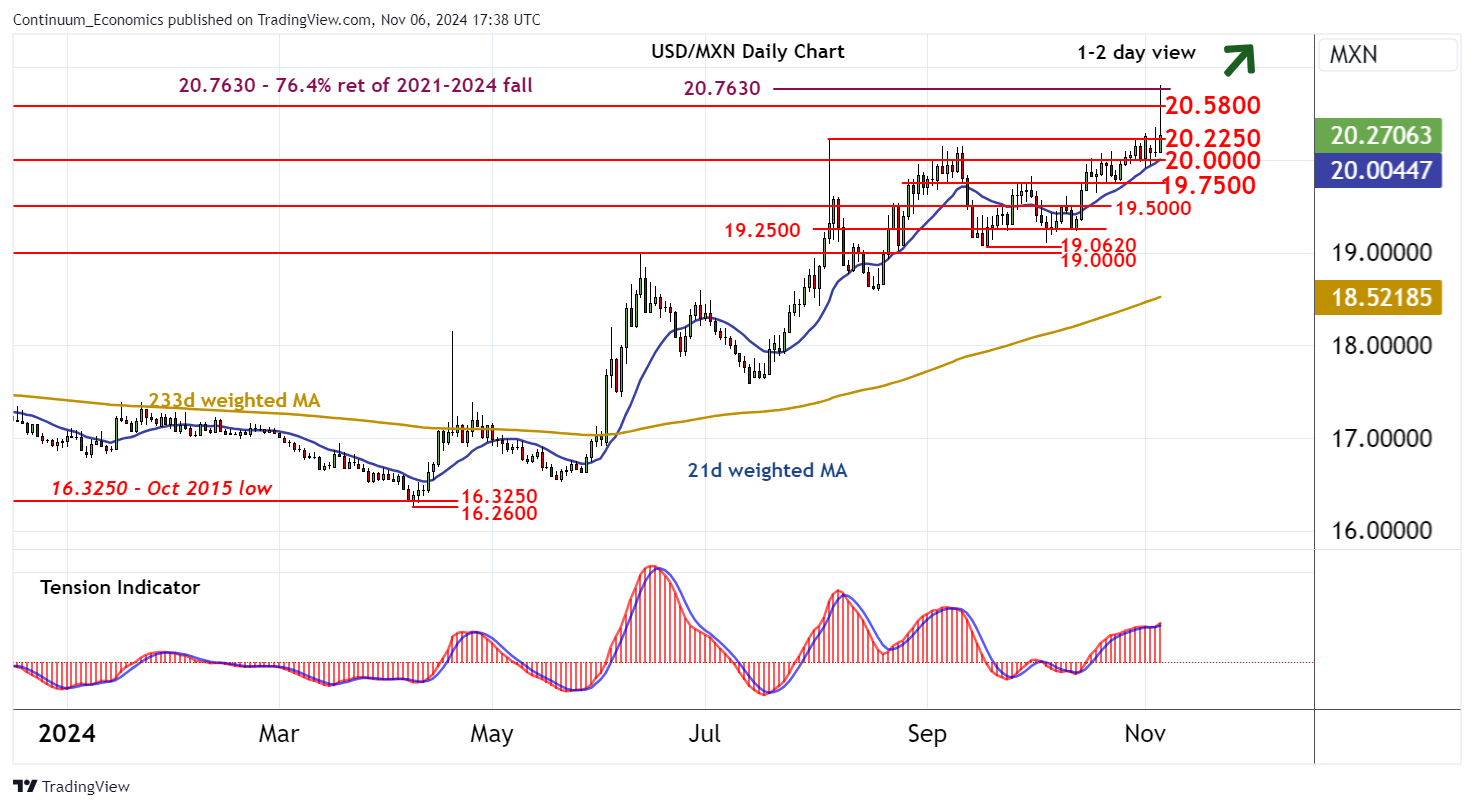
Chart USD/MXN Update: Sharp gains pushed back from the 20.7630 Fibonacci retracement

Senior Technical Strategist
-

Sharp gains have been pushed back from resistance at the 20.7630 long-term Fibonacci retracement

| Levels | Imp | Comment | Levels | Imp | Comment | |||
|---|---|---|---|---|---|---|---|---|
| R4 | 20.8270 | ** | August 2022 high | S1 | 20.0000 | * | congestion | |
| R3 | 20.7630 | ** | 76.4% ret of 2021-2024 fall | S2 | 19.7500 | * | break level | |
| R2 | 20.5800 | ** | September 2022 (m) high | S3 | 19.6460 | 18 Oct low | ||
| R1 | 20.2250 | ** | 5 Aug (m) high | S4 | 19.5000 | * | congestion |
Asterisk denotes strength of level
17:05 BST - Sharp gains have been pushed back from resistance at the 20.7630 long-term Fibonacci retracement, with prices currently trading back below the 20.2250 monthly high of 5 August. Daily readings continue to track lower, highlighting room for fresh losses. But a break below congestion support at 20.0000 is needed to turn sentiment neutral and prompt fresh consolidation above 19.7500. Following corrective trade, improving weekly charts highlight potential for fresh gains. However, a close above 20.7630 is needed to turn sentiment positive and confirm continuation of April gains.