Published: 2024-10-28T01:45:43.000Z
Chart GBP/USD Update: Under pressure

Technical Analyst
-
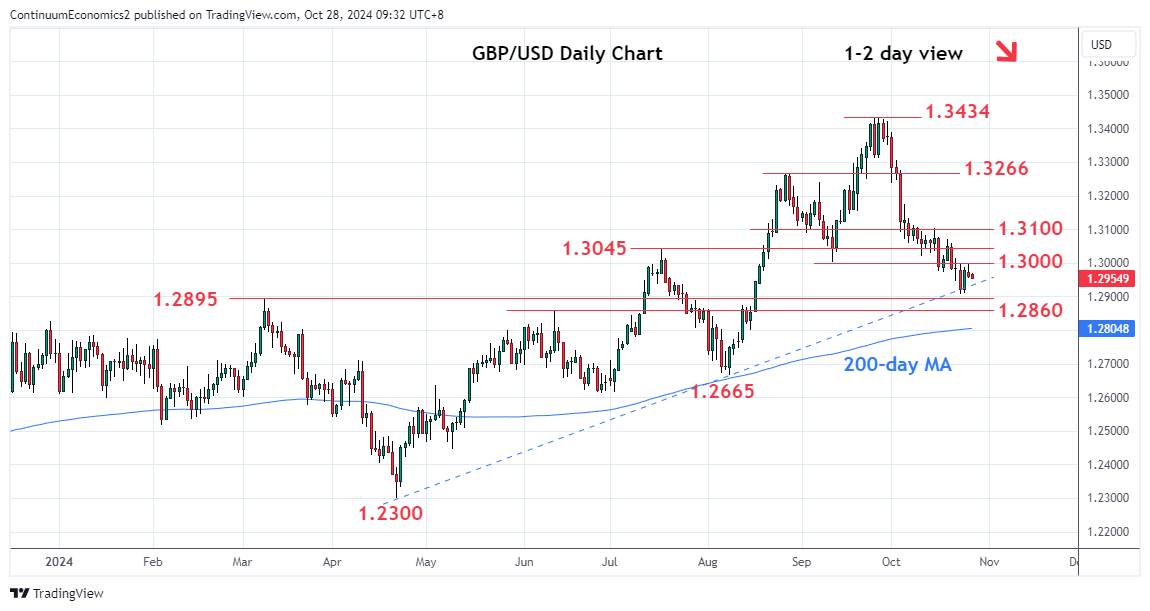
Consolidation above the 1.2907 low has seen bounce checked at the 1.3000 figure

| Level | Comment | Level | Comment | |||||
|---|---|---|---|---|---|---|---|---|
| R4 | 1.3142 | * | Jun 2023 year high | S1 | 1.2900/95 | ** | congestion, Mar high | |
| R3 | 1.3100 | * | congestion | S2 | 1.2865/60 | * | 50% Apr/Sep rally, Jun high | |
| R2 | 1.3045 | ** | Jul high | S3 | 1.2800 | * | congestion | |
| R1 | 1.3000 | * | Sep low, congestion | S4 | 1.2735 | * | 61.8% Apr/Sep rally |
Asterisk denotes strength of level
01:45 GMT - Consolidation above the 1.2907 low has seen bounce checked at the 1.3000 figure. While the daily studies remains in oversold areas shallow bounce keeps pressure firmly on the downside and threaten break lower to expose the strong support at the 1.2895/1.2860, March/June highs. Break here will open up deeper pullback to retrace the April/September rally. Meanwhile, resistance at the 1.3000 figure now expected to cap. Would take close above here to ease the downside pressure and see room to the stronger bounce to the 1.3045 high of July and the 1.3100 level.