Published: 2024-11-15T12:33:18.000Z
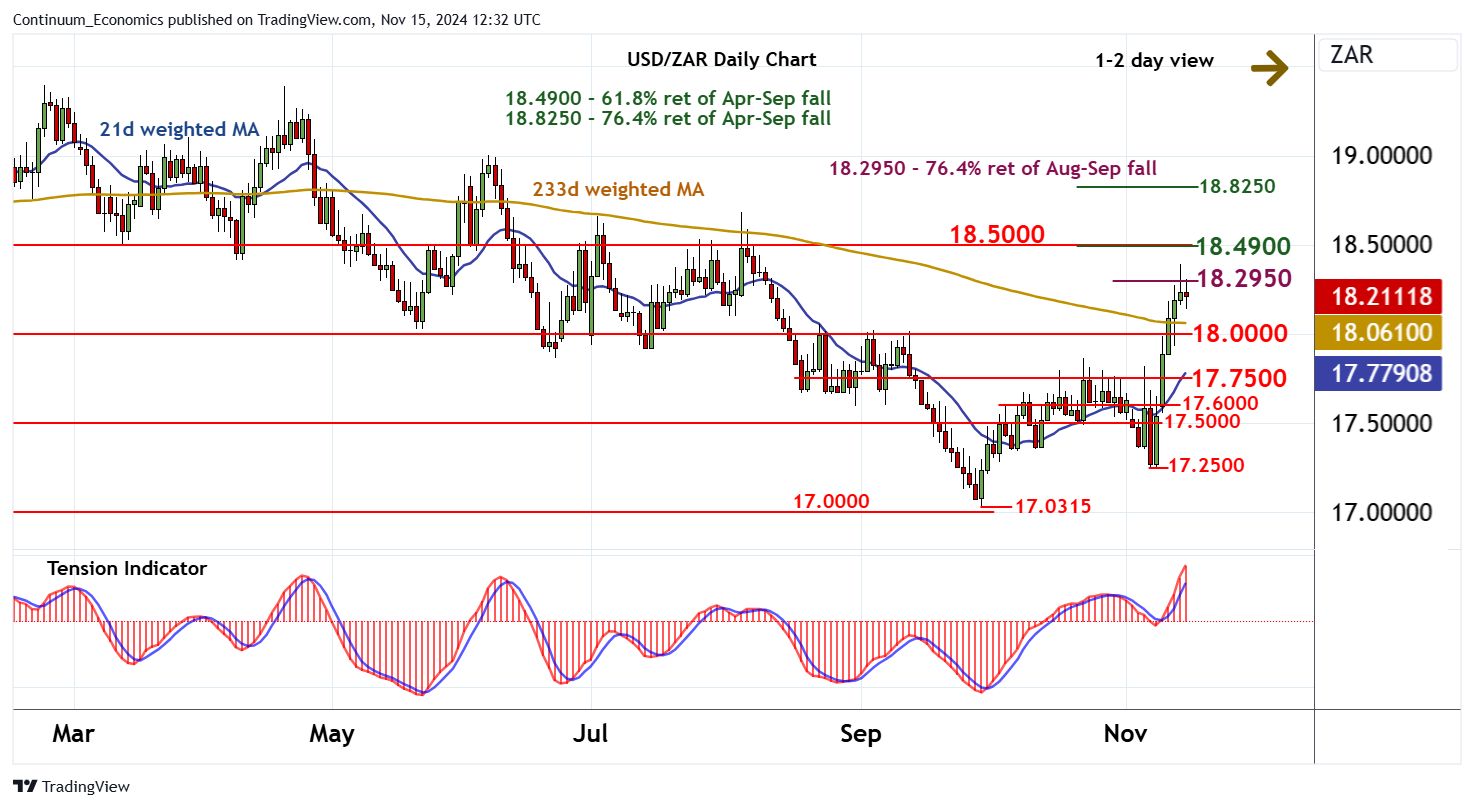
Chart USD/ZAR Update: Turning away from the 18.2950 Fibonacci retracement

Senior Technical Strategist
-

Consolidation beneath the 18.2950 Fibonacci retracement is giving way to a drift lower

| Level | Comment | Level | Comment | |||||
|---|---|---|---|---|---|---|---|---|
| R4 | 18.5000 | * | congestion | S1 | 18.0000 | * | congestion | |
| R3 | 18.4900 | ** | 61.8% ret of Apr-Sep fall | S2 | 17.7500 | * | congestion | |
| R2 | 18.3920 | 14 Nov high | S3 | 17.6000 | * | congestion | ||
| R1 | 18.2950 | ** | 76.4% ret of Aug-Sep fall | S4 | 17.5000 | * | break level |
Asterisk denotes strength of level
12:05 GMT - Consolidation beneath the 18.2950 Fibonacci retracement is giving way to a drift lower, as intraday studies turn down and overbought daily stochastics flatten, with focus expected to turn to congestion support at 18.0000. The rising daily Tension Indicator and positive weekly charts are expected to prompt fresh buying interest around here. A break, however, will add weight to sentiment and prompt a deeper pullback towards further congestion around 17.7500. Meanwhile, a close above 18.2950 is needed to turn sentiment positive once again and extend September gains towards the 18.4900 Fibonacci retracement and congestion around 18.5000.