Published: 2024-11-15T14:26:41.000Z
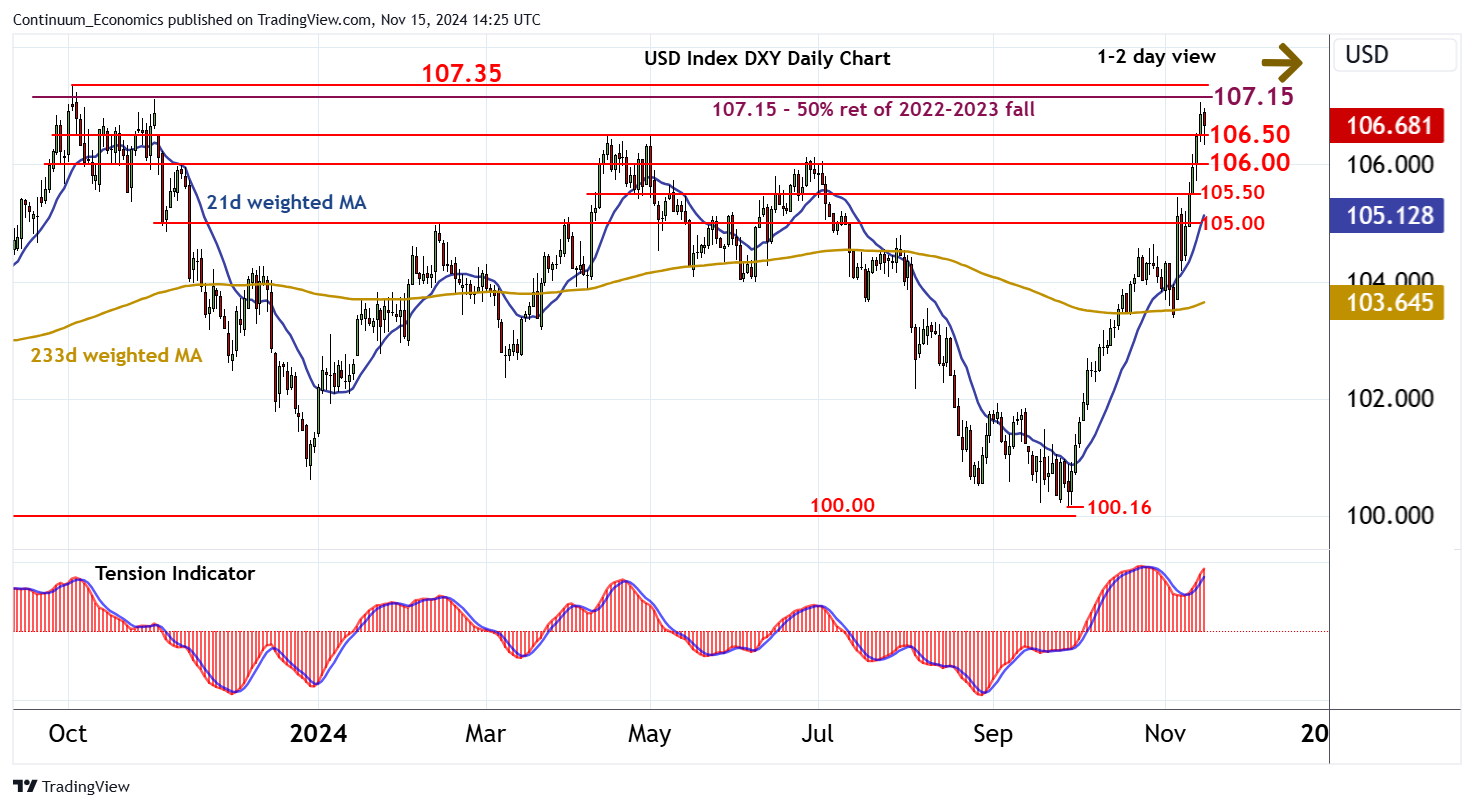
Chart USD Index DXY Update: Balanced beneath critical resistance at 107.15/35

Senior Technical Strategist
-

Little change, as prices extend consolidation beneath the 107.06 current year high of 14 November

| Levels | Imp | Comment | Levels | Imp | Comment | |||
|---|---|---|---|---|---|---|---|---|
| R4 | 108.00 | * | mid-Nov 22 (w) high | S1 | 106.50 | ** | congestion | |
| R3 | 107.35 | * | 3 Oct 2023 (y) high | S2 | 106.00 | * | break level | |
| R2 | 107.15 | ** | 50% ret of 2022-2023 fall | S3 | 105.50 | * | congestion | |
| R1 | 107.06 | * | 14 Nov YTD high | S4 | 105.00 | ** | congestion |
Asterisk denotes strength of level
14:10 GMT - Little change, as prices extend consolidation beneath the 107.06 current year high of 14 November. Just higher is critical resistance within the 107.15 Fibonacci retracement and the 107.35 year high of 3 October 2023. Intraday studies are under pressure and overbought daily stochastics are flattening, suggesting difficulty sustaining any immediate tests of this broad area. However, a close above here will turn sentiment positive once again and open up a run towards the 108.00 weekly high of of mid-November 2022. In the coming sessions, cautious trade is highlighted, with support at congestion around 106.50. A break will open up 106.00. But the positive daily Tension Indicator and mixed/positive weekly charts are expected to prompt renewed buying interest towards here.