Published: 2024-11-11T06:28:50.000Z
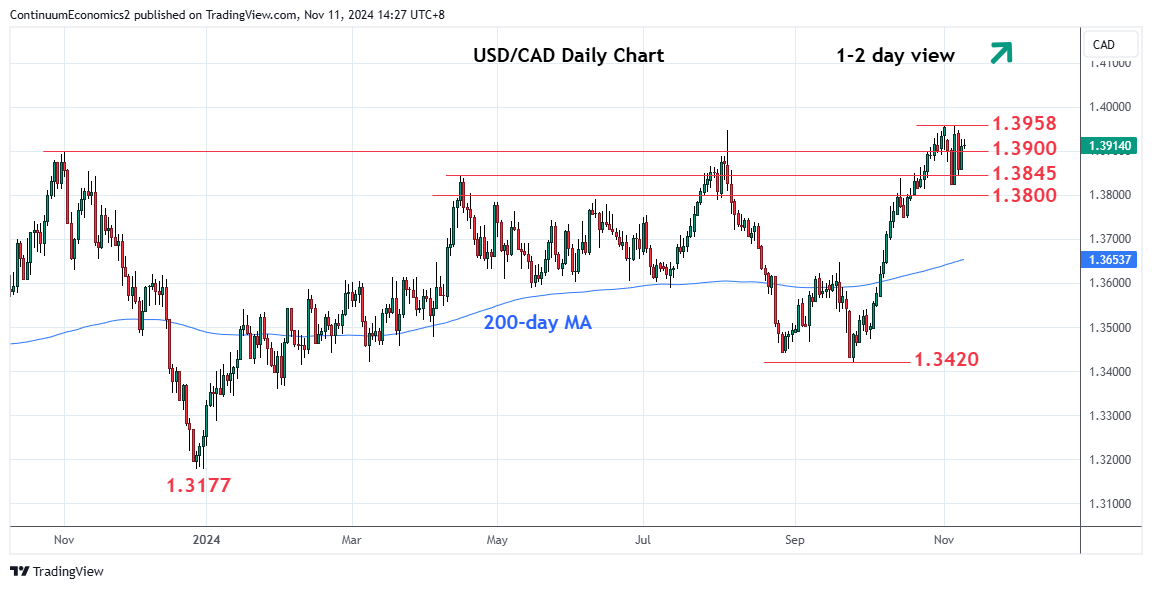
Chart USD/CAD Update: Extending consolidation below 1.3958 high

Senior Technical Strategist
-

Extending choppy trade below the 1.3958 current year high as prices consolidate strong run-up from the 1.3420 low of September

| Levels | Imp | Comment | Levels | Imp | Comment | |||
|---|---|---|---|---|---|---|---|---|
| R4 | 1.4040 | * | 76.4% 2020/2021 fall | S1 | 1.3845 | * | Apr high | |
| R3 | 1.4000 | * | figure | S2 | 1.3817 | ** | 6 Nov low | |
| R2 | 1.3978 | ** | Oct 2022 year high | S3 | 1.3800 | * | congestion | |
| R1 | 1.3958 | ** | 1 Nov YTD high | S4 | 1.3745 | * | 17 Oct low |
Asterisk denotes strength of level
06:20 GMT - Extending choppy trade below the 1.3958 current year high as prices consolidate strong run-up from the 1.3420 low of September. Mixed daily studies suggest further ranging action and pullback to see support at the 1.3845 high of April then the 1.3817 pullback low. Would take break of the latter and then 1.3800 congestion to confirm a top pattern at the 1.3958 high and deeper pullback to retrace gains from the September low. Meanwhile, break above 1.3958 high would open up gains to the October 2022 year high at 1.3978 then the 1.4000 figure.