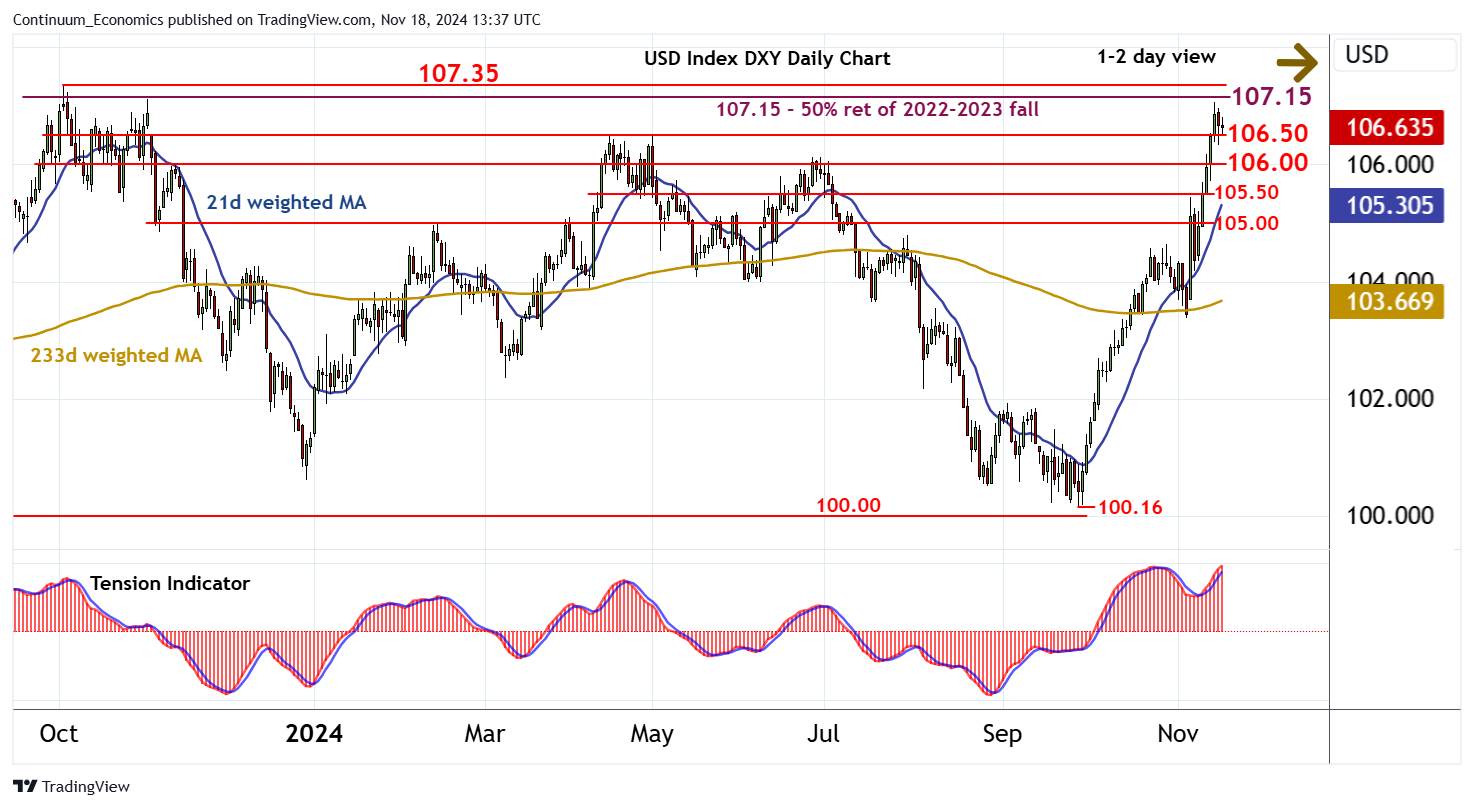
Chart USD Index DXY Update: Balanced at highs

Still little change, as prices extend consolidation above congestion support at 106.50

| Levels | Imp | Comment | Levels | Imp | Comment | |||
|---|---|---|---|---|---|---|---|---|
| R4 | 108.00 | * | mid-Nov 22 (w) high | S1 | 106.50 | ** | congestion | |
| R3 | 107.35 | ** | 3 Oct 2023 (y) high | S2 | 106.00 | * | break level | |
| R2 | 107.15 | ** | 50% ret of 2022-2023 fall | S3 | 105.50 | * | congestion | |
| R1 | 107.06 | * | 14 Nov YTD high | S4 | 105.00 | ** | congestion |
Asterisk denotes strength of level
13:30 GMT - Still little change, as prices extend consolidation above congestion support at 106.50. Intraday studies are mixed/negative and positive daily readings are showing signs of fading, suggesting a deterioration in sentiment and potential for a corrective pullback. A break below 106.50 will open up support at the 106.00 break level. However, mixed/positive weekly charts are expected to limit any initial tests in consolidation. Meanwhile, resistance remains at the 107.06 current year high of 14 November and extends to critical resistance within the 107.15 Fibonacci retracement and the 107.35 year high of 3 October 2023. A close above here will turn sentiment positive once again and open up a run towards the 108.00 weekly high of of mid-November 2022.