Published: 2024-11-20T08:55:47.000Z
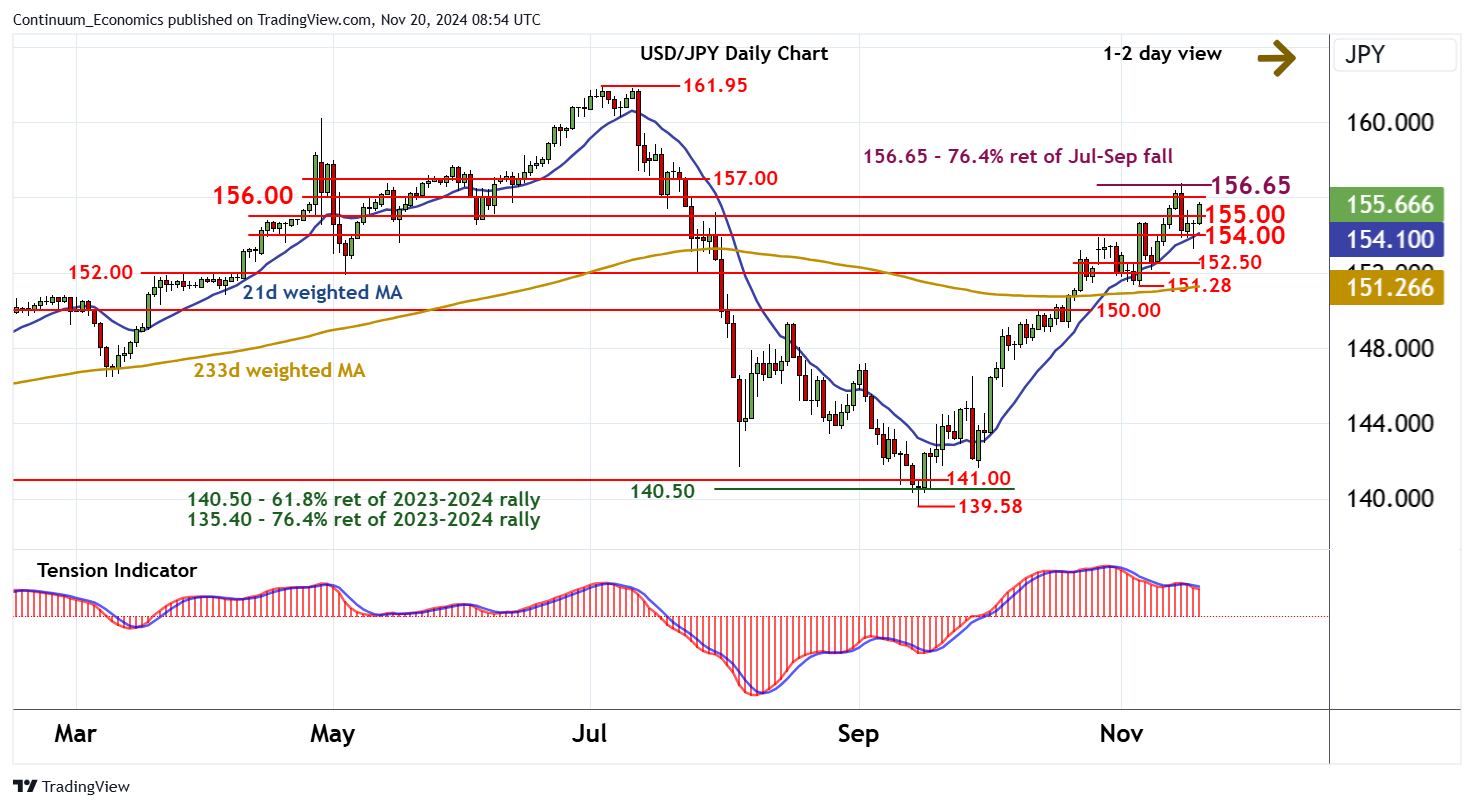
Chart USD/JPY Update: Smart bounce - strong resistance at 156.65

Senior Technical Strategist
2

Anticipated losses have not been seen

| Levels | Imp | Comment | Levels | Imp | Comment | |||
|---|---|---|---|---|---|---|---|---|
| R4 | 157.86 | * | 19 Jul high | S1 | 155.00 | * | congestion | |
| R3 | 157.00 | break level | S2 | 154.00 | * | break level | ||
| R2 | 156.65 | ** | 76.4% ret of Jul-Sep fall | S3 | 153.27 | 19 Nov low | ||
| R1 | 156.00 | * | congestion | S4 | 152.50 | * | break level |
Asterisk denotes strength of level
08:40 GMT - Anticipated losses have not been seen, as unwinding oversold intraday studies prompt a sharp bounce and extend corrective gains towards congestion resistance at 156.00. Beyond here is stronger resistance at the 156.65 Fibonacci retracement. But mixed/negative daily readings and flat overbought weekly stochastics are expected to limit any tests in fresh selling interest. A close above here, however, would turn sentiment positive and extend September gains initially towards the 157.00 break level. Meanwhile, support is raised to congestion around 155.00 and extends to 154.00. This area should underpin any immediate setbacks.