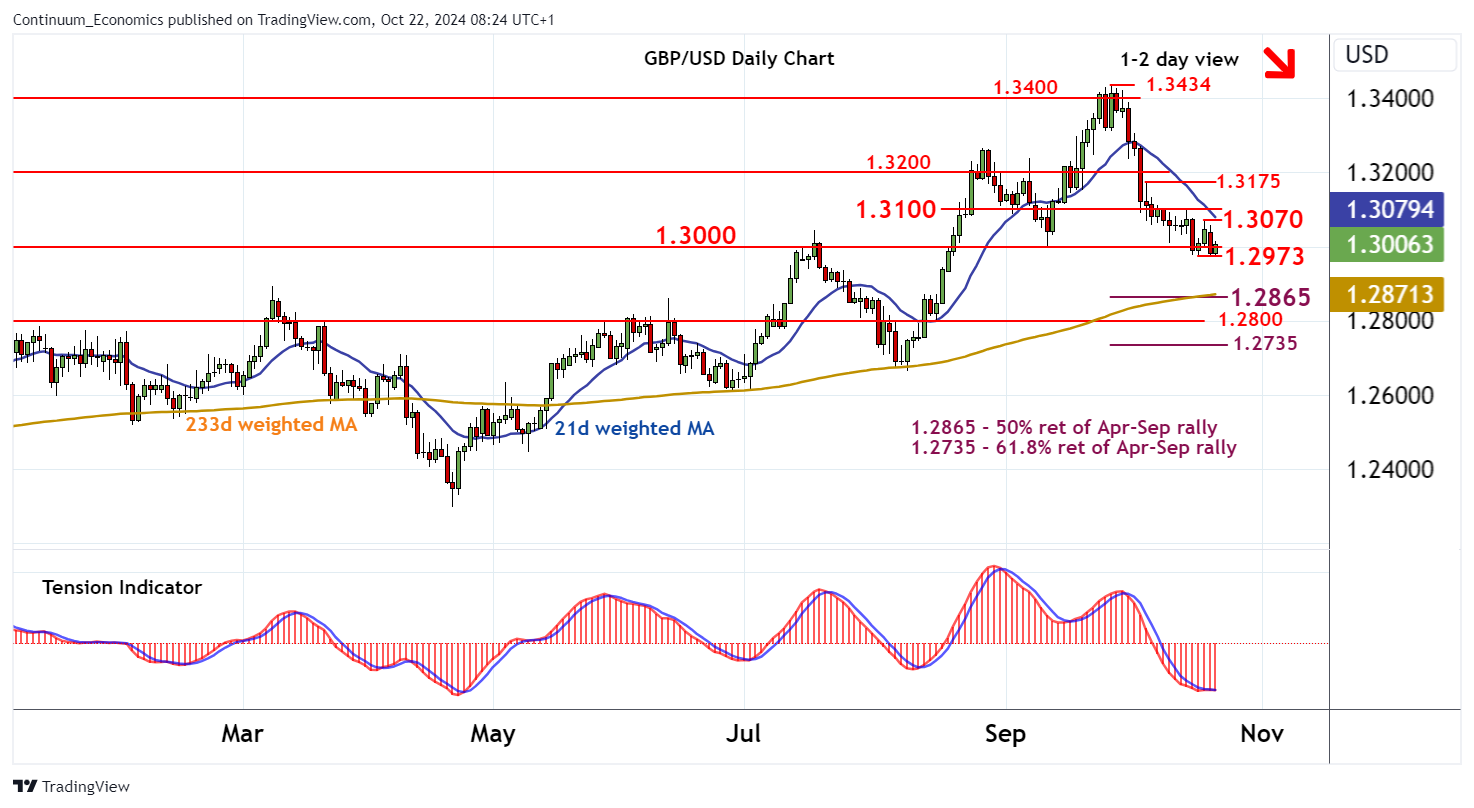
Chart GBP/USD Update: Consolidating test of 1.2973 - background under pressure

The anticipated test of support at the 1.2973 weekly low of 17 October is giving way to a bounce back above 1.3000
| Level | Comment | Level | Comment | |||||
|---|---|---|---|---|---|---|---|---|
| R4 | 1.3200 | * | congestion | S1 | 1.3000 | ** | congestion | |
| R3 | 1.3175 | * | 4 Oct high | S2 | 1.2973 | * | 17 Oct (w) low | |
| R2 | 1.3100 | * | congestion | S3 | 1.2930 | 19 Aug (w) low | ||
| R1 | 1.3070 | * | 18 Oct high | S4 | 1.2865 | ** | 50% ret of Apr-Sep rally |
Asterisk denotes strength of level
08:05 BST - The anticipated test of support at the 1.2973 weekly low of 17 October is giving way to a bounce back above 1.3000, as oversold intraday studies unwind. Daily readings are also rising, suggesting potential for further tests higher. But negative weekly charts are expected to limit scope in fresh selling interest beneath the 1.3070 high of 18 October. An unexpected close above congestion resistance at 1.3100 is needed to turn sentiment positive and extend gains towards 1.3175. Following cautious trade, fresh losses are looked for. A close below 1.2973 will turn sentiment negative and extend September losses towards the 1.2865 Fibonacci retracement.