Published: 2024-10-21T15:57:35.000Z
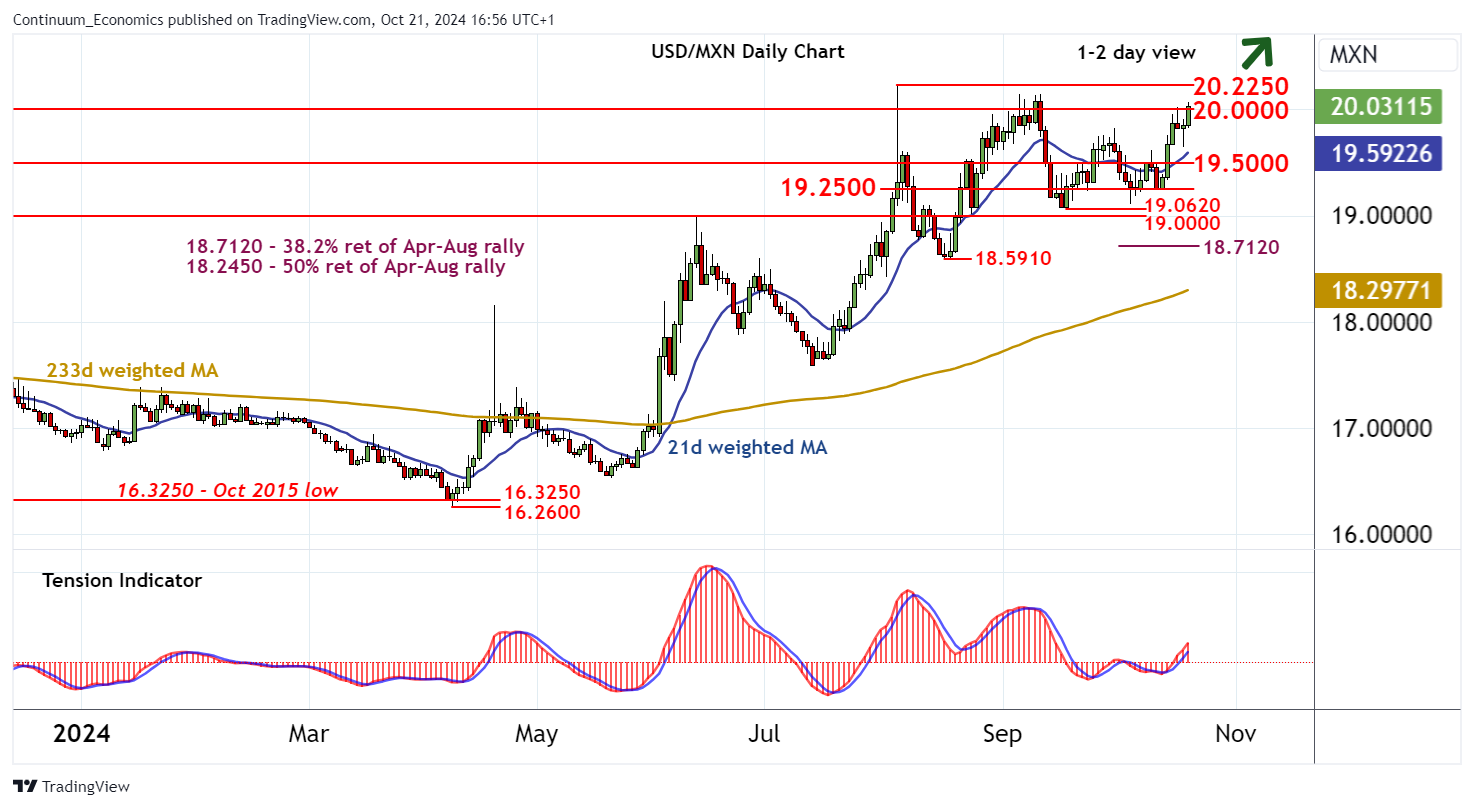
Chart USD/MXN Update: Critical resistance at 20.2250

Senior Technical Strategist
-
The minor pullback from resistance at 20.0000 has bounced smartly from 19.6460
| Levels | Imp | Comment | Levels | Imp | Comment | |||
|---|---|---|---|---|---|---|---|---|
| R4 | 21.0000 | ** | break level | S1 | 19.6460 | 18 Oct low | ||
| R3 | 20.2250 | ** | 5 Aug YTD high | S2 | 19.5000 | * | congestion | |
| R2 | 20.1500 | * | 5 Sep (m) high | S3 | 19.2500 | pivot | ||
| R1 | 20.0000 | figure | S4 | 19.0620 | ** | 18 Sep (m) low |
Asterisk denotes strength of level
16:45 BST - The minor pullback from resistance at 20.0000 has bounced smartly from 19.6460, with prices once again pressuring 20.0000. A break will open up critical resistance at the 20.2250 current year high of 5 August. But mixed daily and weekly charts are expected to limit any initial tests in further consolidation. A close above here would turn sentiment outright positive and extend April gains initially towards 21.0000. Meanwhile, support is down to congestion around 19.5000 and should continue to underpin any immediate setbacks.