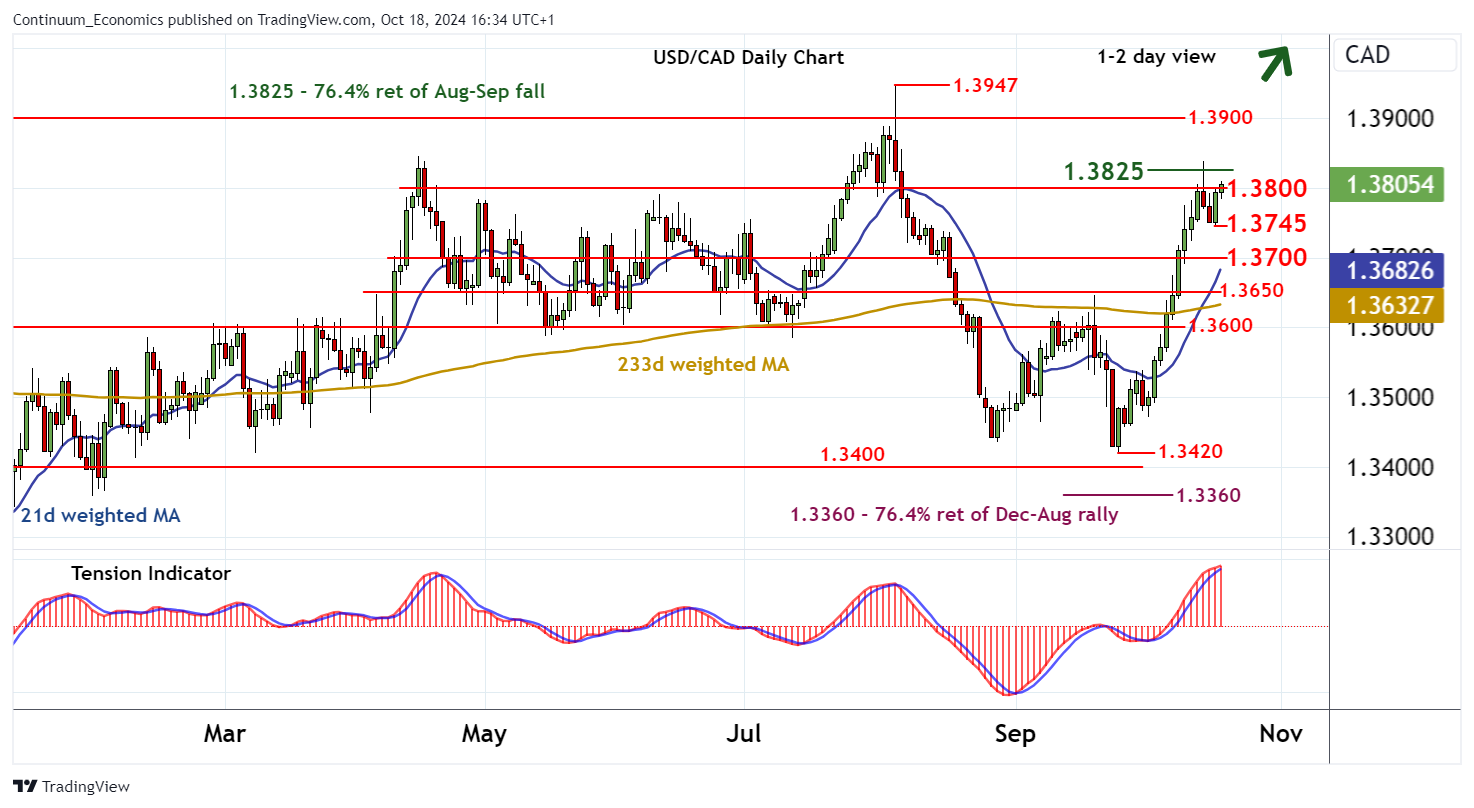
Chart USD/CAD Update: Extending pressure on 1.3800/25

Little change, as cautious trade extends pressure on resistance at congestion around 1.3800 and the 1.3825 Fibonacci retracement
| Levels | Imp | Comment | Levels | Imp | Comment | |||
|---|---|---|---|---|---|---|---|---|
| R4 | 1.3900 | * | figure | S1 | 1.3745 | * | 17 Oct low | |
| R3 | 1.3835 | * | 15 Oct high | S2 | 1.3700 | congestion | ||
| R2 | 1.3825 | ** | 76.4% ret of Aug-Sep fall | S3 | 1.3650 | ** | break level | |
| R1 | 1.3800 | ** | congestion | S4 | 1.3600 | ** | break level |
Asterisk denotes strength of level
16:20 BST - Little change, as cautious trade extends pressure on resistance at congestion around 1.3800 and the 1.3825 Fibonacci retracement. A tick higher in intraday studies highlights a test of here. But overbought daily stochastics and the flattening positive daily Tension Indicator suggest any immediate tests of 1.3825 could give way to further consolidation, before rising weekly charts extend gains still further. A close above 1.3825 would turn sentiment positive once again and extend September gains towards 1.3900. Meanwhile, support is raised to the 1.3745 low of 17 October. A close beneath here, if seen, would add weight to sentiment and open up a test of 1.3650.