Chart AUD/USD Update: Limited tests higher

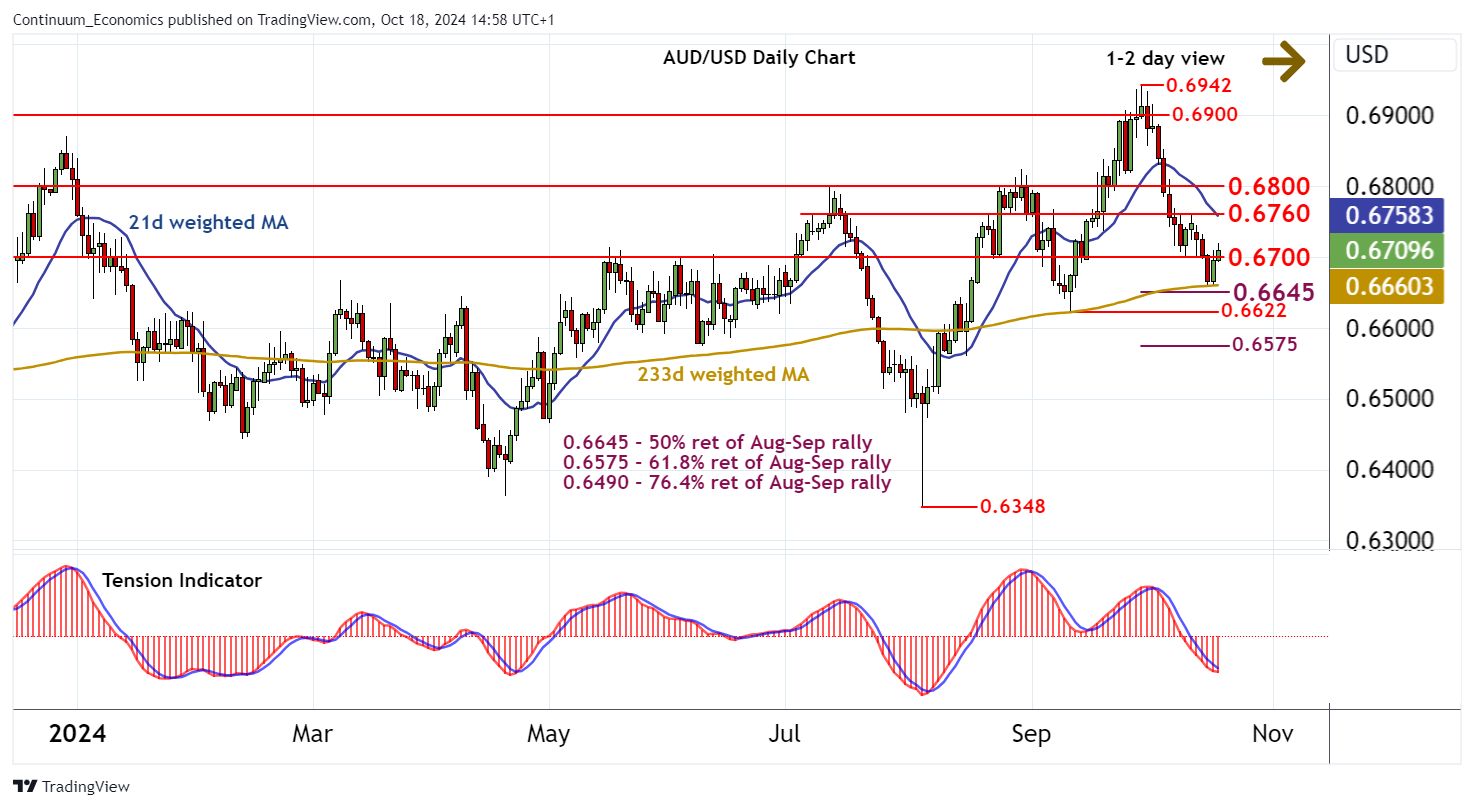
Consolidation above support at the 0.6645 Fibonacci retracement is giving way to a bounce
| Levels | Imp | Comment | Levels | Imp | Comment | |||
|---|---|---|---|---|---|---|---|---|
| R4 | 0.6900 | * | congestion | S1 | 0.6700 | ** | congestion | |
| R3 | 0.6840 | break level | S2 | 0.6645 | ** | 50% ret of Aug-Sep rally | ||
| R2 | 0.6800 | ** | break level | S3 | 0.6622 | ** | 11 Sep (m) low | |
| R1 | 0.6760 | break level | S4 | 0.6600 | * | congestion |
Asterisk denotes strength of level
14:40 BST - Consolidation above support at the 0.6645 Fibonacci retracement is giving way to a bounce, as intraday studies track higher, with prices currently balanced back above 0.6700. Oversold daily stochastics are unwinding and the bearish daily Tension Indicator is flattening, suggesting potential for further strength in the coming sessions. But negative weekly charts are expected to limit scope in renewed selling interest towards 0.6760. Following corrective trade, lower levels are looked for. However, a close below 0.6645 is needed to turn sentiment outright negative and extend September losses towards the 0.6622 monthly low of 11 September. Initial tests could give way to range trade, before prices continue lower.