Published: 2024-10-18T10:32:06.000Z
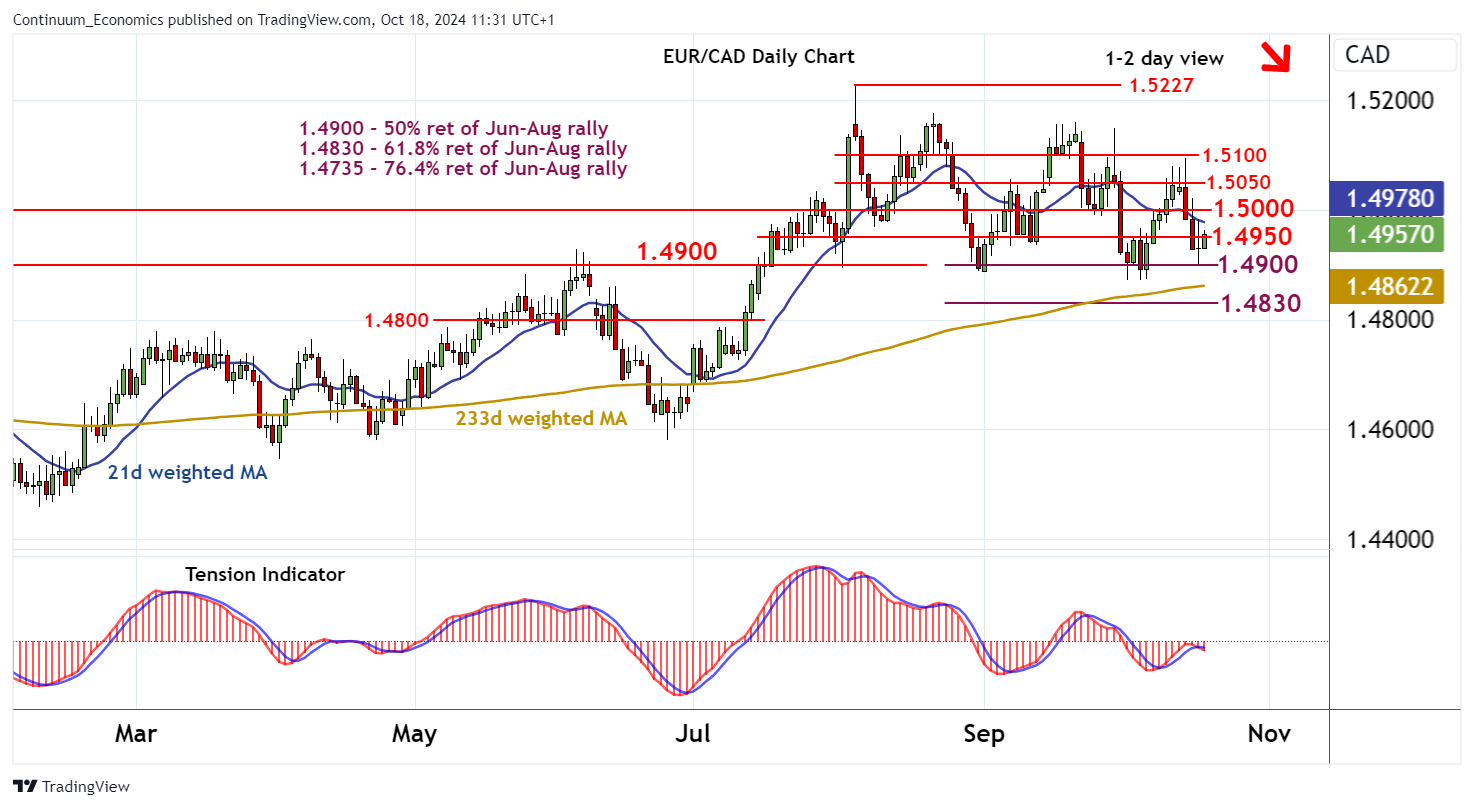
Chart EUR/CAD Update: Consolidating test of the 1.4900 Fibonacci retracement

Senior Technical Strategist
-
Anticipated losses have reached support at the 1.4900 Fibonacci retracement
| Level | Comment | Level | Comment | |||||
|---|---|---|---|---|---|---|---|---|
| R4 | 1.5100 | * | break level | S1 | 1.4900 | ** | 50% ret of Jun-Aug rally | |
| R3 | 1.5050 | break level | S2 | 1.4830 | ** | 61.8% ret of Jun-Aug rally | ||
| R2 | 1.5000 | * | congestion | S3 | 1.4800 | * | congestion | |
| R1 | 1.4950 | congestion | S4 | 1.4735 | ** | 76.4% ret of Jun-Aug rally |
Asterisk denotes strength
11:10 BST - Anticipated losses have reached support at the 1.4900 Fibonacci retracement, where unwinding oversold intraday studies have prompted a bounce to 1.4950. Continuation towards further congestion around 1.5000 cannot be ruled out, but negative daily readings and bearish weekly charts should limit any tests in fresh selling interest. Following corrective trade, fresh losses are looked for. A close below 1.4900 is needed to turn sentiment outright negative and confirm continuation of August losses, initially to the 1.4830 retracement.