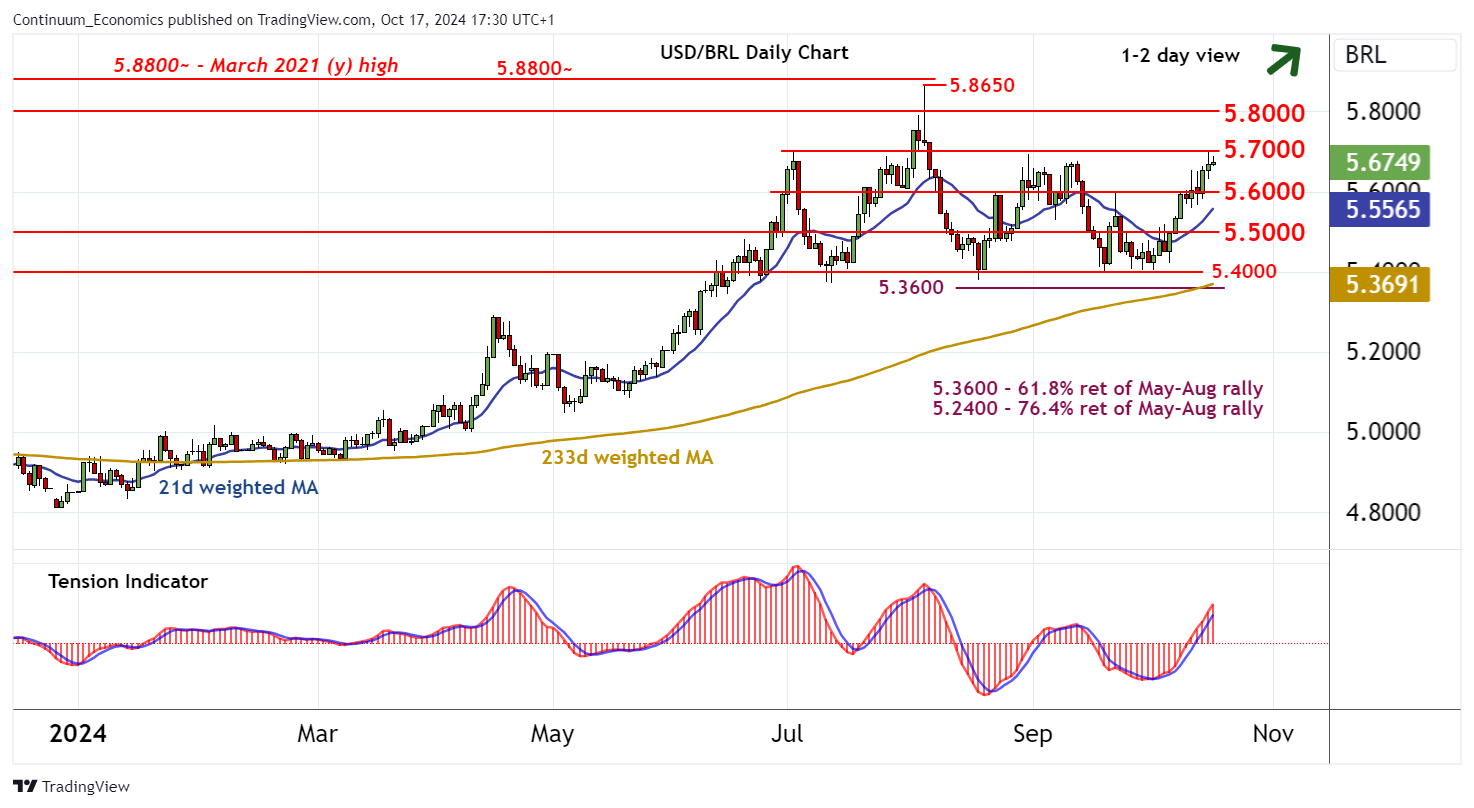
Chart USD/BRL Update: Consolidating test of 5.7000

Consolidation around 5.6000 has given way to a break higher
| Levels | Imp | Comment | Levels | Imp | Comment | |||
|---|---|---|---|---|---|---|---|---|
| R4 | 5.8800~ | ** | March 2021 (y) high | S1 | 5.6000 | * | congestion | |
| R3 | 5.8650 | ** | 5 Aug YTD high | S2 | 5.5000 | * | break level | |
| R2 | 5.8000 | ** | figure | S3 | 5.4000 | congestion | ||
| R1 | 5.7000 | break level | S4 | 5.3600 | ** | 61.8% ret of May-Aug rally |
Asterisk denotes strength of level
17:20 BST - Consolidation around 5.6000 has given way to a break higher, with prices currently consolidating the test of resistance at 5.7000. Daily stochastics are flat in overbought areas, suggesting further consolidation, before the rising daily Tension Indicator and improving weekly charts prompt further gains. A later close above 5.7000 will improve sentiment and extend August gains towards critical resistance at the 5.8650 current year high of 5 August and the 5.8800~ year high of March 2021. Meanwhile, a close back below 5.6000, if seen, will add weight to sentiment and promote a swift pullback towards 5.5000, where renewed consolidation is expected to develop.