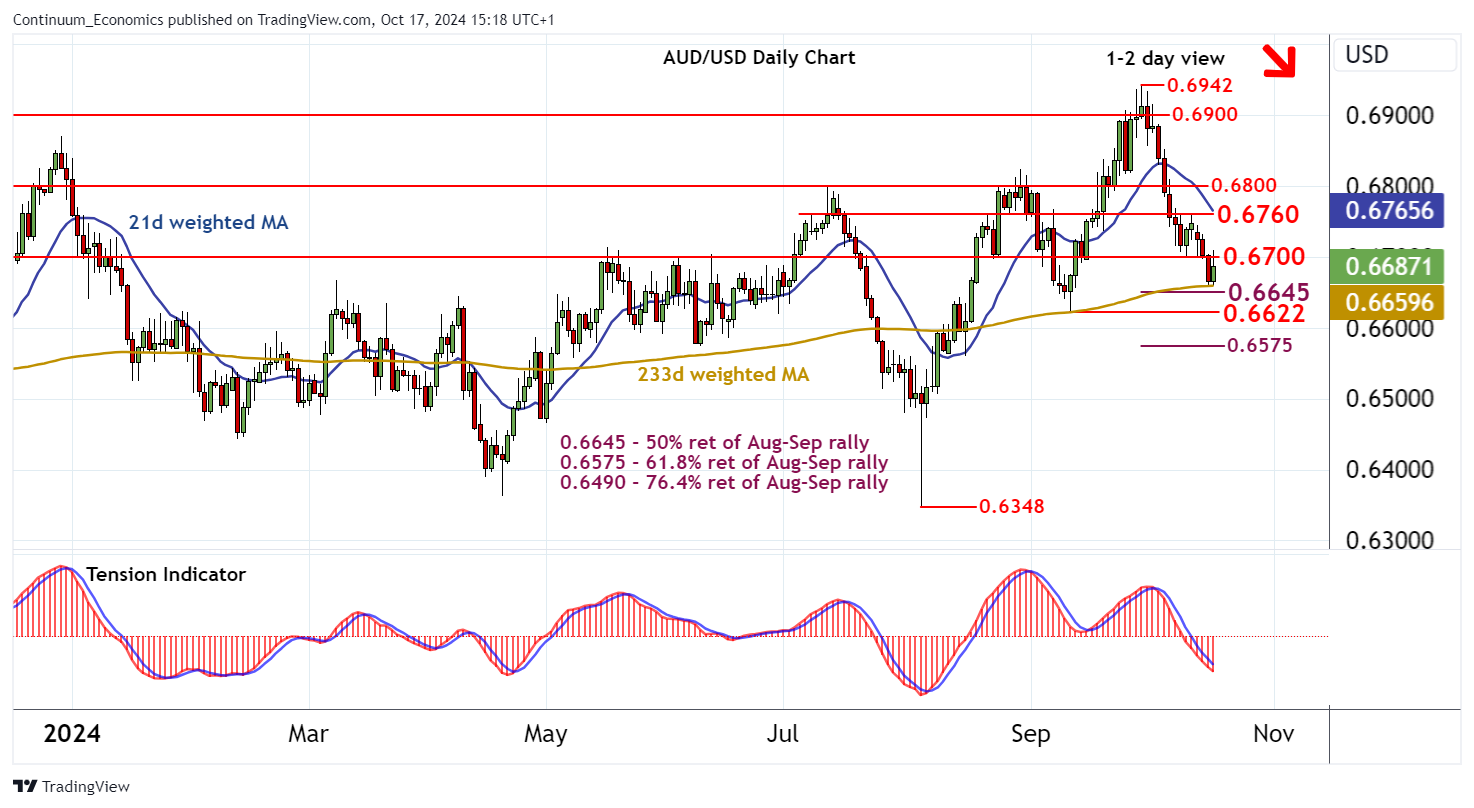
Chart AUD/USD Update: Consolidating September losses - studies under pressure

The break below 0.6700 is giving way to consolidation above support at 0.6645 Fibonacci retracement
| Levels | Imp | Comment | Levels | Imp | Comment | |||
|---|---|---|---|---|---|---|---|---|
| R4 | 0.6840 | break level | S1 | 0.6645 | ** | 50% ret of Aug-Sep rally | ||
| R3 | 0.6800 | ** | break level | S2 | 0.6622 | ** | 11 Sep (m) low | |
| R2 | 0.6760 | break level | S3 | 0.6600 | * | congestion | ||
| R1 | 0.6700 | ** | congestion | S4 | 0.6575 | ** | 61.8% ret of Aug-Sep rally |
Asterisk denotes strength of level
15:15 BST - The break below 0.6700 is giving way to consolidation above support at 0.6645 Fibonacci retracement, as intraday studies turn higher and oversold daily stochastics flatten. A test back above 0.6700 cannot be ruled out. But the negative daily Tension Indicator and bearish weekly charts are expected to limit scope in renewed selling interest beneath 0.6760. Following cautious trade, a break below 0.6645 will add weight to sentiment and extend September losses towards the 0.6622 monthly low of 11 September. Initial tests could give way to range trade, before prices continue lower. Meanwhile, a close back above 0.6700 will turn sentiment neutral and prompt consolidation beneath 0.6760.