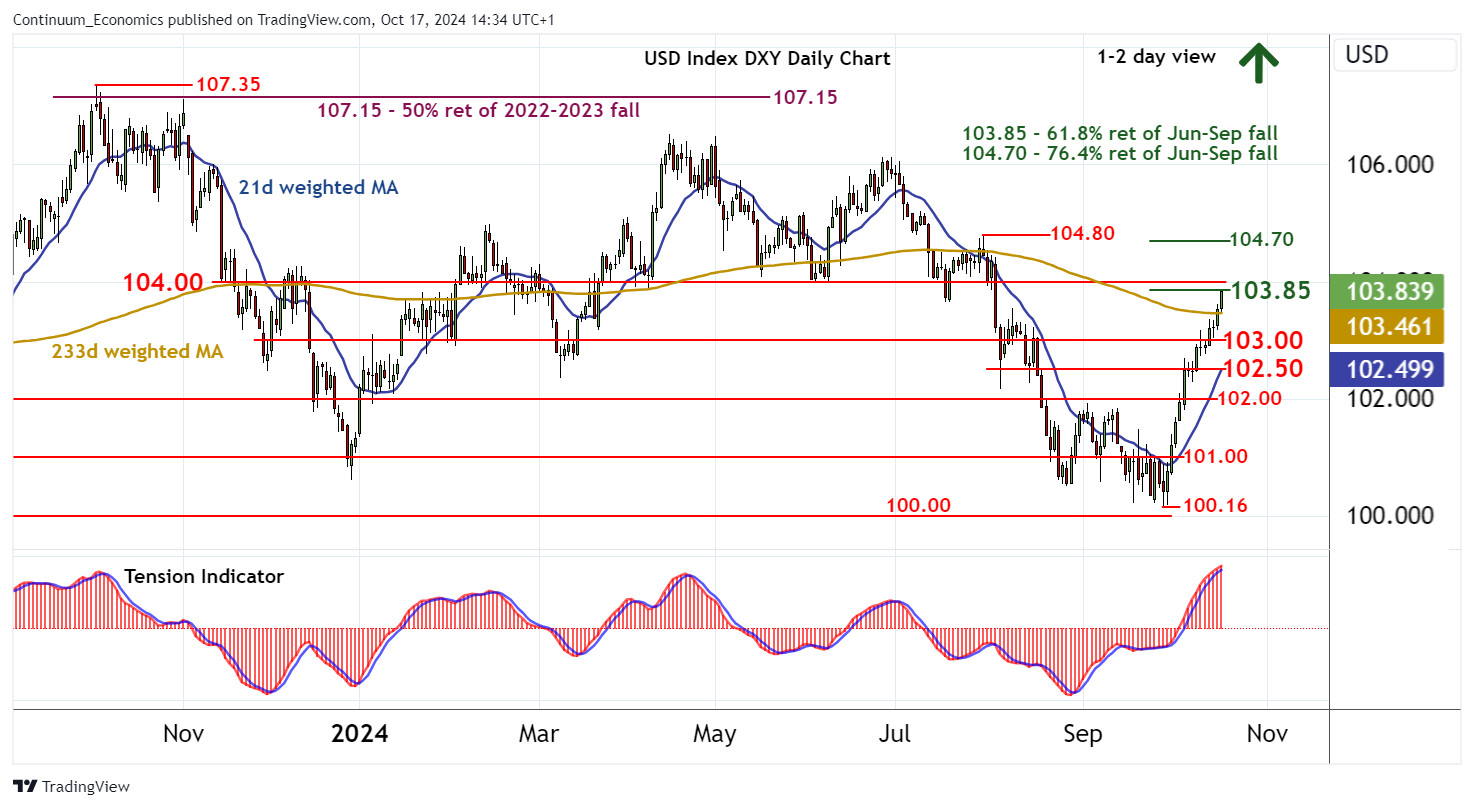
Chart USD Index DXY Update: Pressuring the 103.85 Fibonacci retracement

Consolidation has given way to a fresh break higher
| Levels | Imp | Comment | Levels | Imp | Comment | |||
|---|---|---|---|---|---|---|---|---|
| R4 | 104.80 | ** | 30 Jul (m) high | S1 | 103.00 | ** | congestion | |
| R3 | 104.70 | ** | 76.4% ret of Jun-Sep fall | S2 | 102.50 | ** | congestion | |
| R2 | 104.00 | * | congestion | S3 | 102.00 | * | congestion | |
| R1 | 103.85 | ** | 61.8% ret of Jun-Sep fall | S4 | 101.50 | break level |
Asterisk denotes strength of level
14:15 BST - Consolidation has given way to a fresh break higher, with September gains currently pressuring strong resistance at the 103.55 weekly high of 8 August. Just higher is congestion resistance at 104.00. Daily readings are positive and broader weekly charts continue to strengthen, highlighting room for a later break above this area and bullish extension towards the 104.70 retracement and 104.80 monthly high of 30 July. However, already overbought daily stochastics should prompt profit-taking towards here and limit any tests in fresh consolidation. Meanwhile, support remains at congestion around 103.00. A break beneath here would turn sentiment neutral and prompt consolidation above further congestion around 102.50.