Chart USD/CHF Update: Edging higher

The anticipated break above 0.8650 has reached 0.8670~
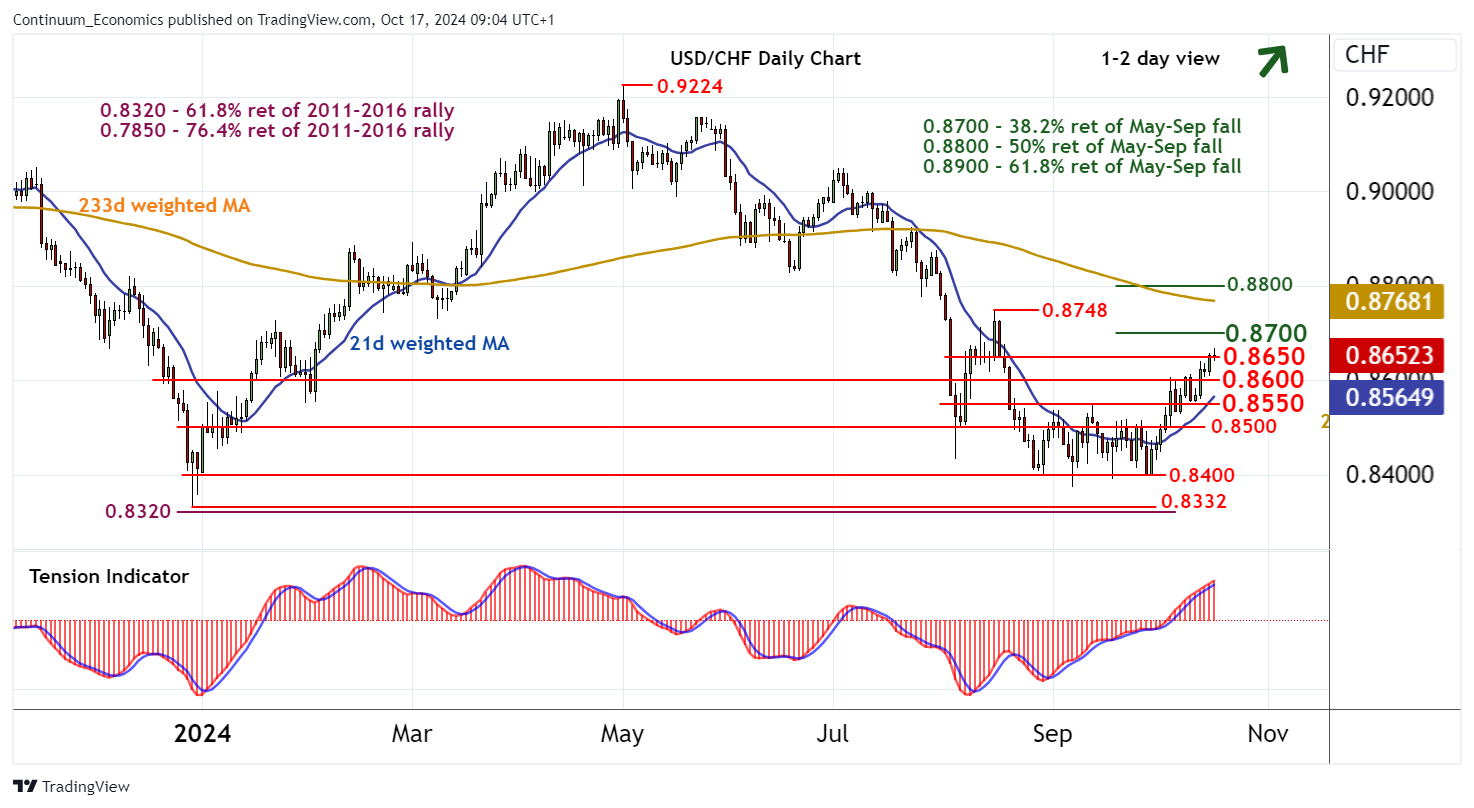
| Level | Comment | Level | Comment | |||||
|---|---|---|---|---|---|---|---|---|
| R4 | 0.8800 | ** | break level, 50% ret | S1 | 0.8600 | ** | congestion | |
| R3 | 0.8748 | ** | 15 Aug (w) high | S2 | 0.8550 | * | congestion | |
| R2 | 0.8700 | * | 38.2% ret of May-Sep fall | S3 | 0.8500 | congestion | ||
| R1 | 0.8650 | * | break level | S4 | 0.8450 | * | break level |
Asterisk denotes strength of level
08:55 BST - The anticipated break above 0.8650 has reached 0.8670~, where overbought intraday studies are prompting minor selling interest and pullback to 0.8650. The daily Tension Indicator continues to rise, highlighting potential for a test of resistance at the 0.8700 Fibonacci retracement. But flattening overbought daily stochastics are expected to limit any initial tests in consolidation, before improving weekly charts prompt a break and extend September gains towards 0.8748. Meanwhile, support remains at congestion around 0.8650. A close beneath here, if seen, will turn sentiment neutral and give way to renewed consolidation above further congestion around 0.8550.