Published: 2024-10-17T07:25:05.000Z
Chart GBP/USD Update: Extending September losses

Senior Technical Strategist
2
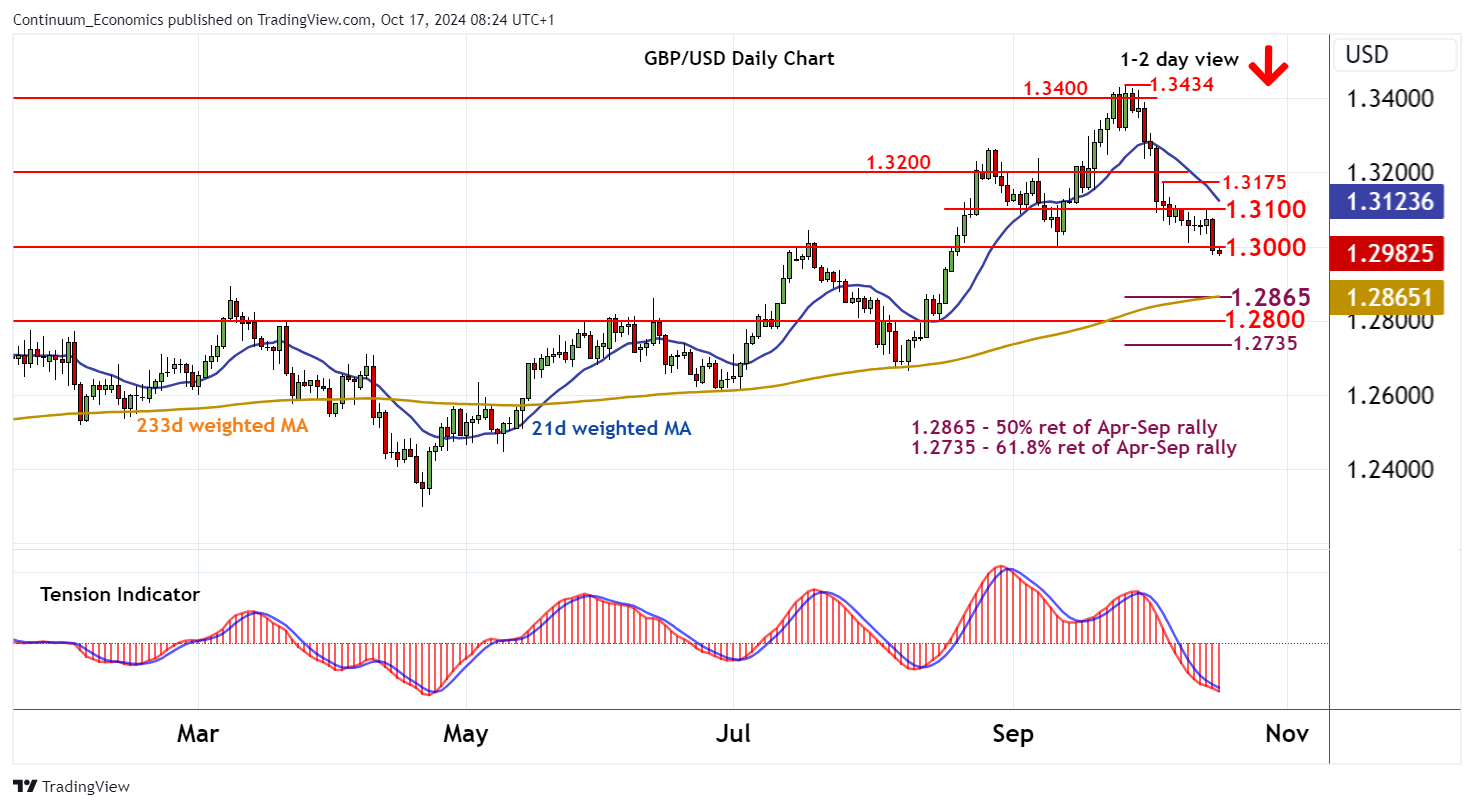
Consolidation around 1.3000 has given way to the anticipated break
| Level | Comment | Level | Comment | |||||
|---|---|---|---|---|---|---|---|---|
| R4 | 1.3200 | * | congestion | S1 | 1.2930 | 19 Aug (w) low | ||
| R3 | 1.3175 | * | 4 Oct high | S2 | 1.2865 | ** | 50% ret of Apr-Sep rally | |
| R2 | 1.3100 | * | congestion | S3 | 1.2800 | * | congestion | |
| R1 | 1.3000 | ** | congestion, 11 Sep (m) low | S4 | 1.2735 | ** | 61.8% ret of Apr-Sep rally |
Asterisk denotes strength of level
08:05 BST - Consolidation around 1.3000 has given way to the anticipated break, with prices currently trading around 1.2980. The daily Tension Indicator is coming under fresh pressure and broader weekly charts are negative, highlighting room for continuation of September losses towards strong support at the 1.2865 Fibonacci retracement. Meanwhile, a close back above 1.3000 would help to stabilise price action and delay downside development, as prices settle into fresh consolidation beneath congestion resistance at 1.3100.