Chart USD/CAD Update: Consolidating - potential for a minor test lower

Little change, as prices extend consolidation
| Levels | Imp | Comment | Levels | Imp | Comment | |||
|---|---|---|---|---|---|---|---|---|
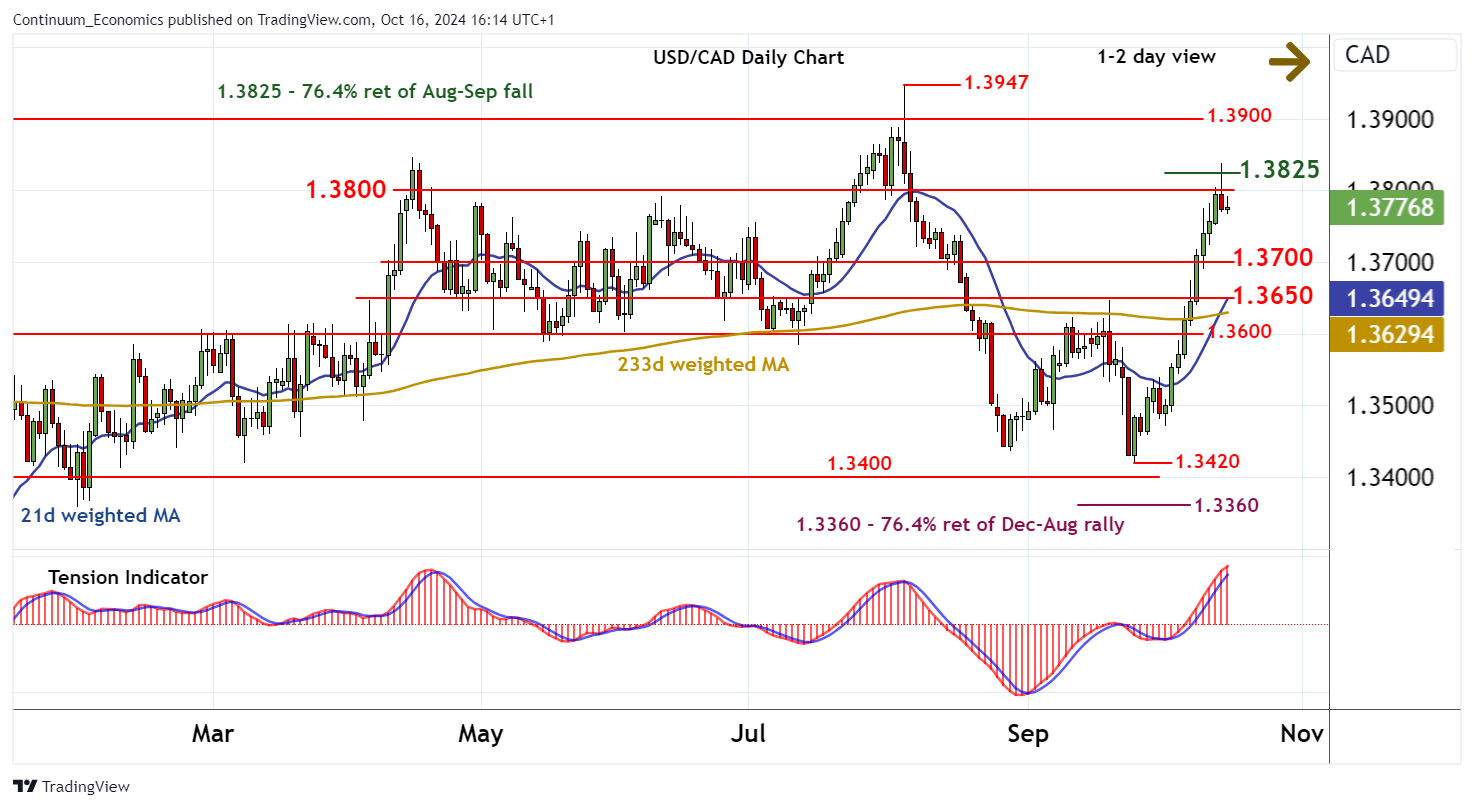
| R4 | 1.3900 | * | figure | S1 | 1.3700 | congestion | ||
| R3 | 1.3835 | * | 15 Oct high | S2 | 1.3650 | ** | break level | |
| R2 | 1.3825 | ** | 76.4% ret of Aug-Sep fall | S3 | 1.3600 | ** | break level | |
| R1 | 1.3800 | ** | congestion | S4 | 1.3550 | intraday break level |
Asterisk denotes strength of level
16:05 BST - Little change, as prices extend consolidation following the test of strong resistance at congestion around 1.3800 and the 1.3825 Fibonacci retracement. Intraday studies are under pressure and overbought daily stochastics are unwinding, highlighting potential for a pullback in the coming sessions. However, the daily Tension Indicator continues to rise and broader weekly charts are positive, suggesting any losses should be limited in renewed buying interest above congestion support at 1.3700. Following corrective trade, fresh gains are looked for. But a close above 1.3825 is needed to turn sentiment positive once again and extend September gains towards 1.3900.