Chart USD Index DXY Update: Strong resistance at 103.55

Consolidation has given way to the anticipated test higher
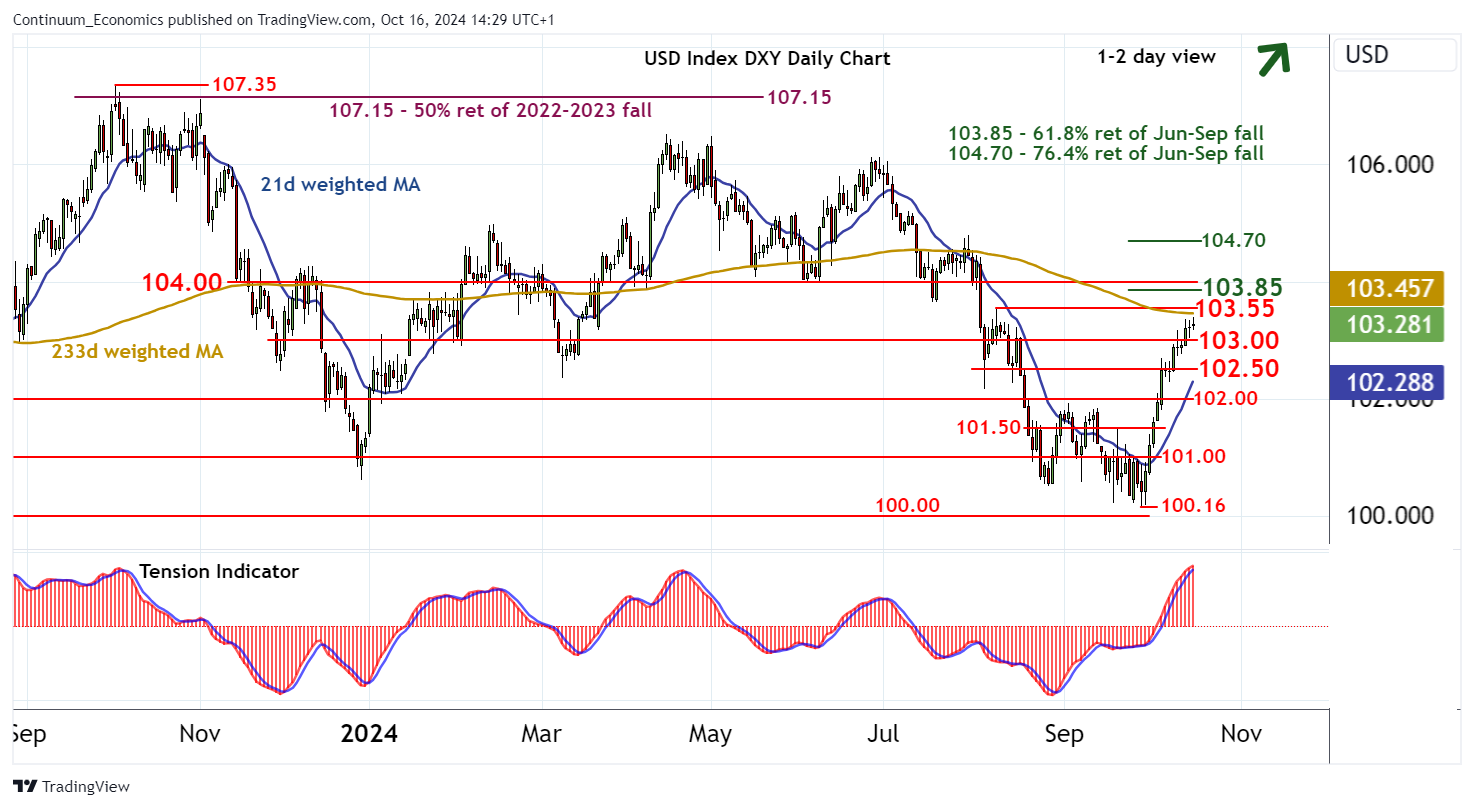
| Levels | Imp | Comment | Levels | Imp | Comment | |||
|---|---|---|---|---|---|---|---|---|
| R4 | 104.85 | ** | 61.8% ret of Jun-Sep fall | S1 | 103.00 | ** | congestion | |
| R3 | 104.00 | * | congestion | S2 | 102.50 | ** | congestion | |
| R2 | 103.85 | ** | 61.8% ret of Jun-Sep fall | S3 | 102.00 | * | congestion | |
| R1 | 103.55 | * | 8 Aug (w) high | S4 | 101.50 | break level |
Asterisk denotes strength of level
14:00 BST - Consolidation has given way to the anticipated test higher, with the break above 103.00 currently trading just below 103.30. The rising daily Tension Indicator is flattening and daily stochastics are flat in overbought areas, suggesting cautious trade beneath strong resistance at the 103.55 weekly high of 8 August. However, broader weekly charts continue to strengthen, pointing to room for a later break above here and continuation of September gains towards the 103.85 Fibonacci retracement. Meanwhile, support is raised to congestion around 103.00. A break beneath here would turn sentiment neutral and prompt consolidation above further congestion around 102.50.