Published: 2024-10-15T16:48:34.000Z
Chart USD/MXN Update: Limited tests higher

Senior Technical Strategist
-
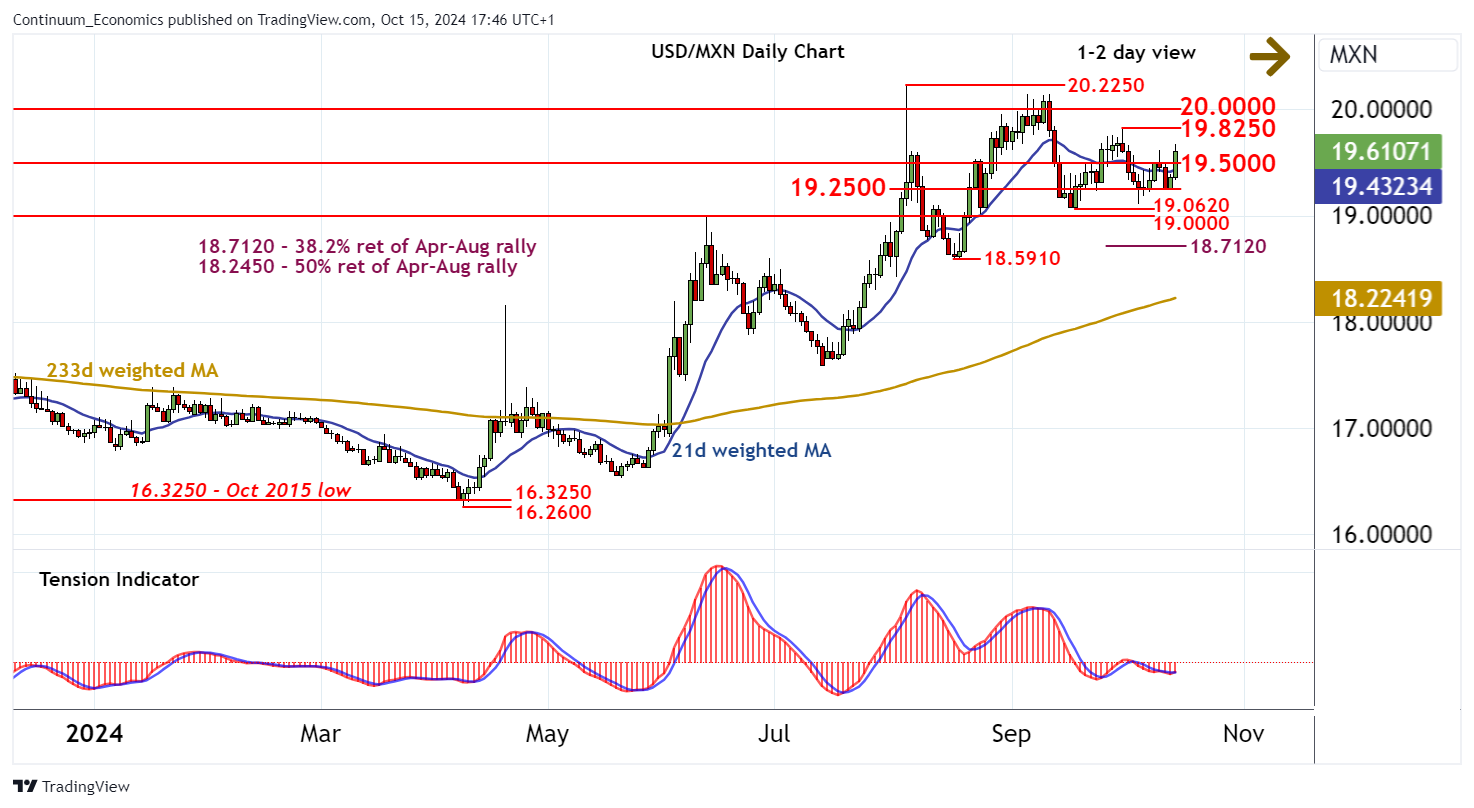
Cautious trade above support at 19.2500 is giving way to a test higher
| Levels | Imp | Comment | Levels | Imp | Comment | |||
|---|---|---|---|---|---|---|---|---|
| R4 | 20.1500 | * | 5 Sep (m) high | S1 | 19.5000 | congestion | ||
| R3 | 20.0000 | figure | S2 | 19.2500 | pivot | |||
| R2 | 19.8250 | ** | 1 Oct high | S3 | 19.0620 | ** | 18 Sep (m) low | |
| R1 | 19.5000 | congestion | S4 | 19.0000 | * | break level |
Asterisk denotes strength of level
17:20 BST - Cautious trade above support at 19.2500 is giving way to a test higher, with prices currently trading above 19.5000. The improving daily Tension Indicator suggests potential for a test of resistance at the 19.8250 high of 1 October. But flat daily stochastics and negative weekly charts are expected to prompt fresh selling interest around here. Meanwhile, support is down to 19.2500. However, a close below the 19.0620 monthly low of 18 September and 19.0000 is needed to turn sentiment negative and confirm continuation of September losses, initially to the 18.7120 Fibonacci retracement.