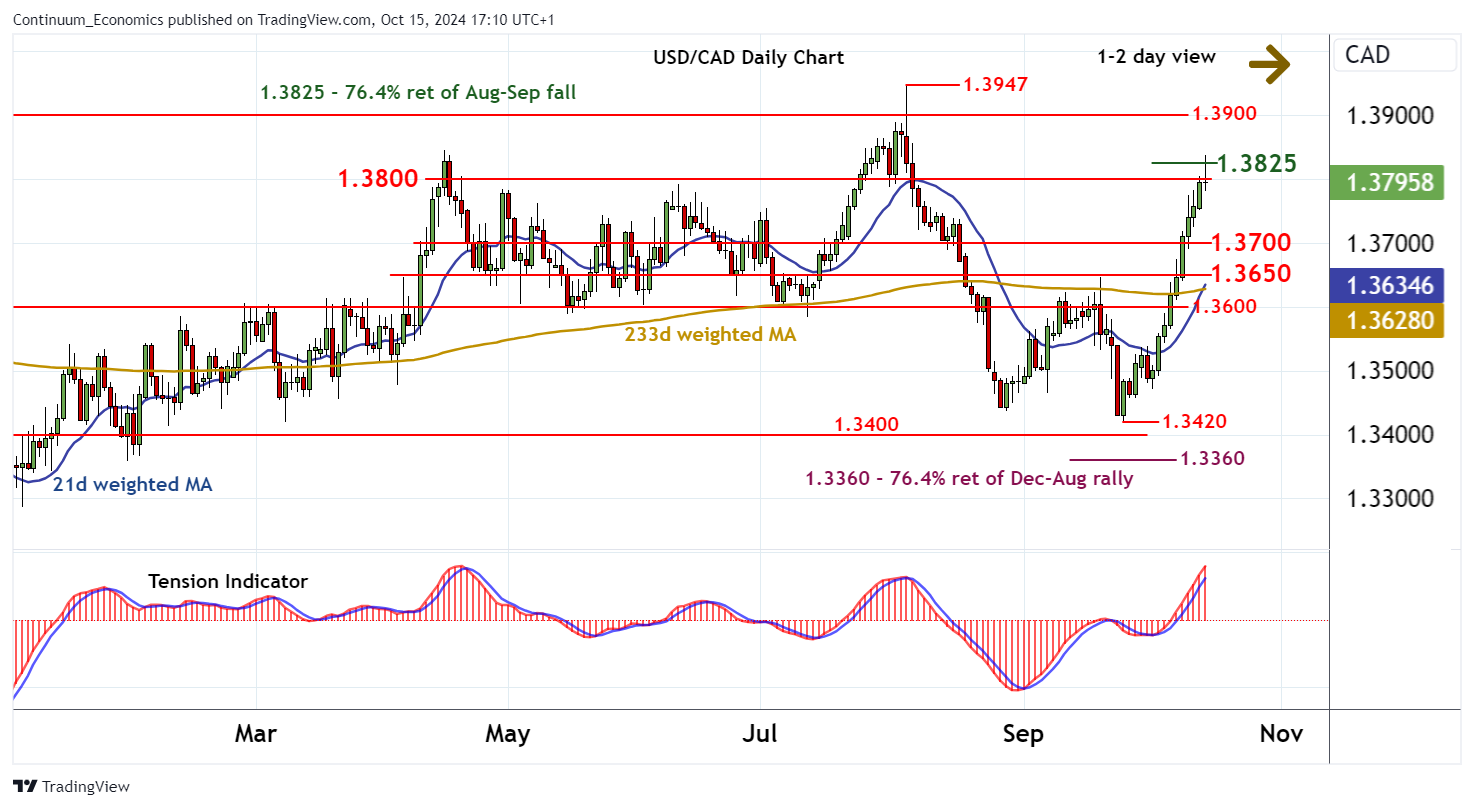
Chart USD/CAD Update: Consolidating test of strong resistance at 1.3800/25

The test of strong resistance at congestion around 1.3800 and the 1.3825 Fibonacci retracement has been pushed back
| Levels | Imp | Comment | Levels | Imp | Comment | |||
|---|---|---|---|---|---|---|---|---|
| R4 | 1.3947 | ** | 5 Aug YTD high | S1 | 1.3700 | congestion | ||
| R3 | 1.3900 | * | figure | S2 | 1.3650 | ** | break level | |
| R2 | 1.3825 | ** | 76.4% ret of Aug-Sep fall | S3 | 1.3600 | ** | break level | |
| R1 | 1.3800 | ** | congestion | S4 | 1.3550 | intraday break level |
Asterisk denotes strength of level
16:40 BST - The test of strong resistance at congestion around 1.3800 and the 1.3825 Fibonacci retracement has been pushed back from 1.3835~, as intraday studies unwind overbought areas, with prices once again trading below 1.3800. Daily stochastics are flat in overbought areas, suggesting potential for a minor pullback. But the rising daily Tension Indicator and positive weekly charts are expected to limit any losses in renewed buying interest above congestion support at 1.3700. Following corrective trade, fresh gains are looked for. But a close above 1.3825 is needed to turn sentiment positive once again and extend September gains towards 1.3900.