Published: 2024-10-15T12:17:45.000Z
Chart USD/RUB Update: Strong resistance at the 97.8250 Fibonacci retracement

Senior Technical Strategist
-
The test of the 97.8250 Fibonacci retracement has given way to a pullback
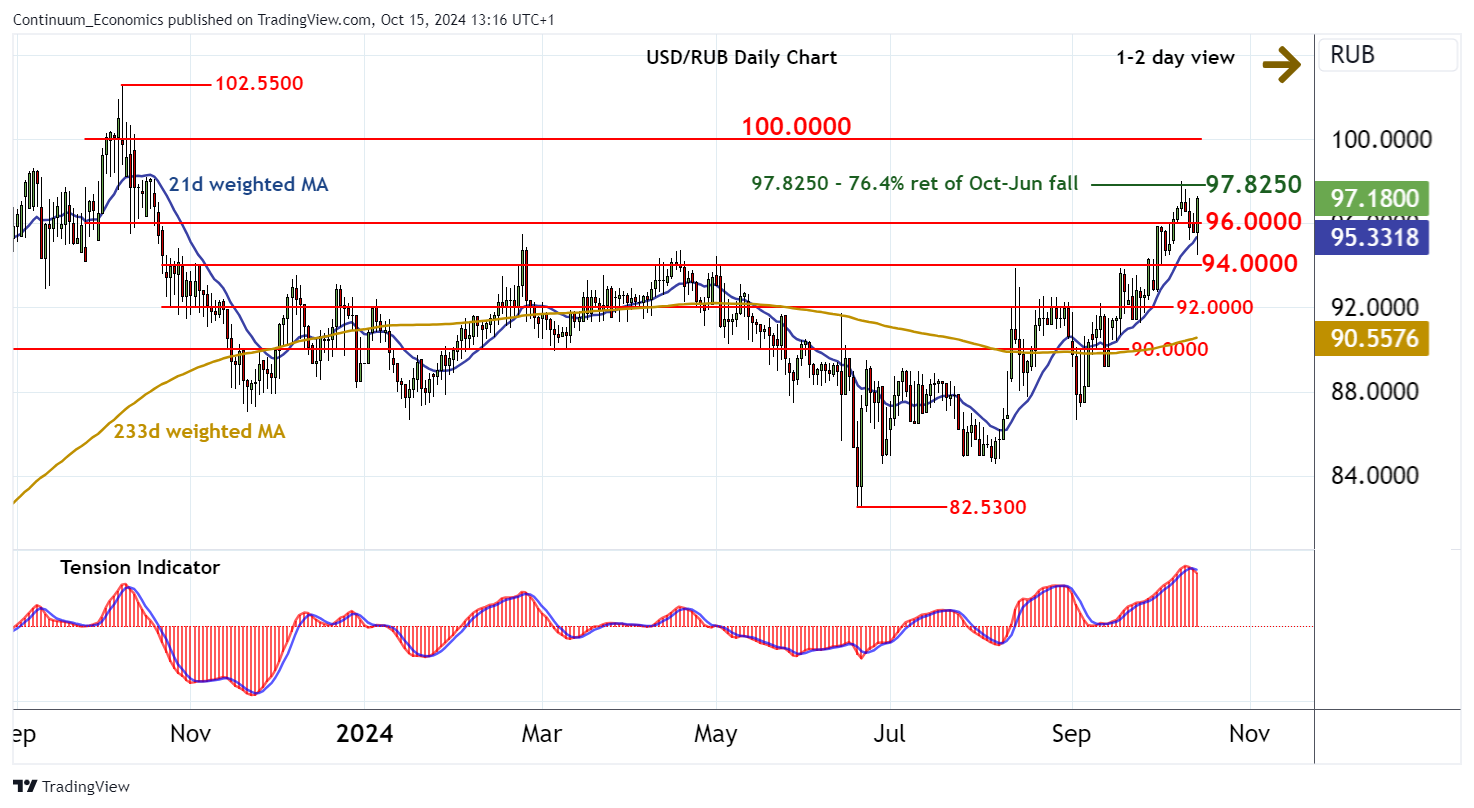
| Levels | Comment | Levels | Comment | |||||
| R4 | 102.5500 | ** | 9 Oct 2023 (m) high | S1 | 96.0000 | * | congestion | |
| R3 | 100.0000 | ** | congestion | S2 | 94.0000 | * | break level | |
| R2 | 98.0000 | 9 Oct YTD high | S3 | 92.0000 | ** | congestion | ||
| R1 | 97.8250 | ** | 76.4% ret of Oct-Jun fall | S4 | 90.0000 | ** | congestion |
Asterisk denotes strength of level
12:55 BST - The test of the 97.8250 Fibonacci retracement has given way to a pullback, with the break below 96.0000 meeting buying interest above 94.0000. Prices are trading back above 96.0000, with focus turning to 97.8250 and the 98.0000 current year high of 9 October. Negative daily readings and flat overbought weekly charts are expected to limit any fresh tests in consolidation. However, a close above here will turn sentiment positive and confirm continuation of June gains towards 100.0000. Meanwhile, a close below 94.0000 would turn sentiment negative and prompt a swift pullback towards 92.0000.