Published: 2024-10-15T02:55:13.000Z
Chart USD/THB Update: Consolidating at 33.11 pullback low

Technical Analyst
-
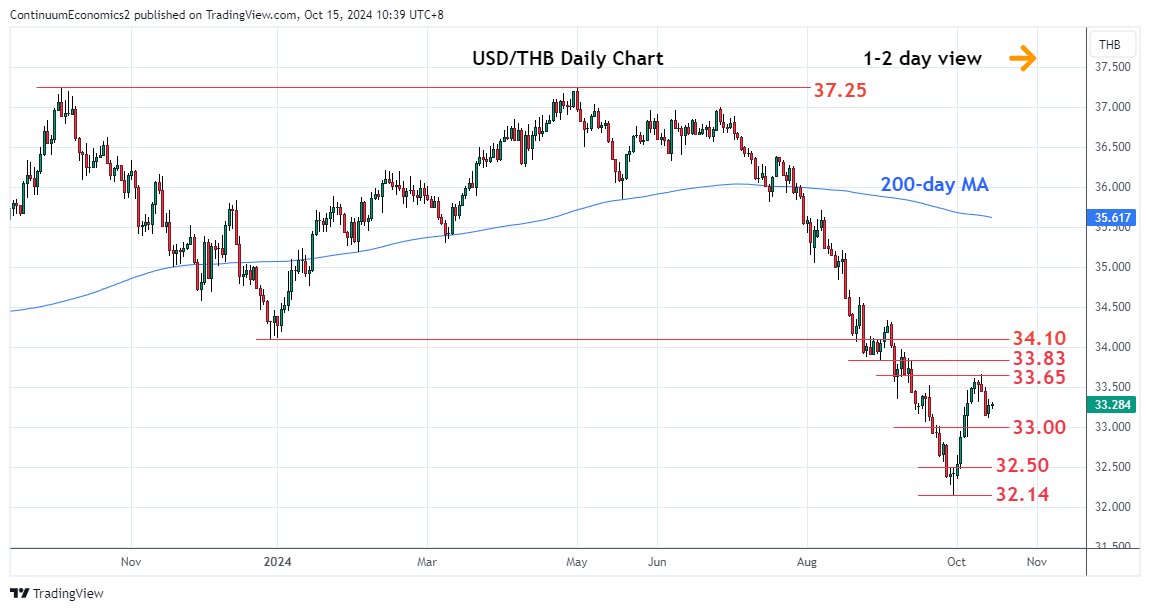
Edged up from the 33.11 low as prices consolidate losses from the 33.65 high of last week
| Level | Comment | Level | Comment | |||||
|---|---|---|---|---|---|---|---|---|
| R4 | 34.10 | ** | Dec low | S1 | 33.11 | 14 Oct low | ||
| R3 | 34.00 | * | 38.2% Jun/Sep fall | S2 | 33.00 | * | congestion | |
| R2 | 33.83 | * | 30 Aug low | S3 | 32.50 | * | congestion | |
| R1 | 33.65 | * | 8 Oct high | S4 | 32.14 | ** | 30 Sep YTD low |
Asterisk denotes strength of level
02:45 GMT - Edged up from the 33.11 low as prices consolidate losses from the 33.65 high of last week. Daily studies have turned mixed and suggest the latter now expected to cap. A later break, if seen, will return focus to the upside to further retrace the June/September losses. Higher will see room to the 33.83 resistance then the strong resistance at the 34.00/34.10, 38.2% Fibonacci level and December low. Meanwhile, support at the 33.11/33.00 area now underpin. Would take break here to return focus to the downside for retest of the 32.50 support then the 32.14, September YTD low.