Published: 2024-10-15T01:03:17.000Z
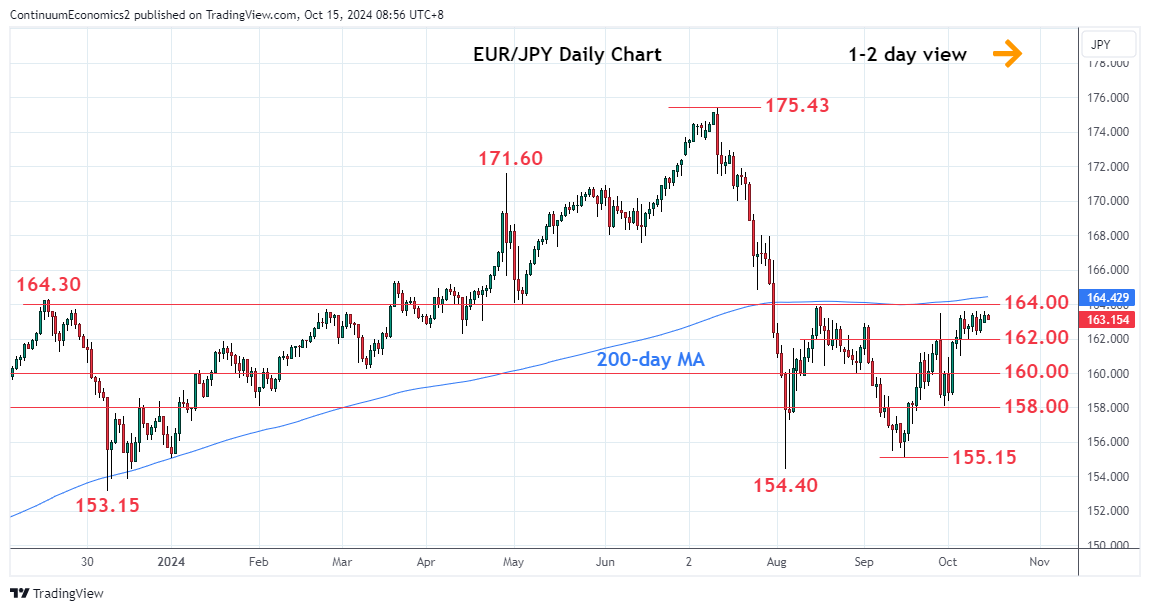
Chart EUR/JPY Update: Extending consolidation below 163.60/90 highs

Technical Analyst
3
Extending consolidation below the 163.60 high
| Levels | Imp | Comment | Levels | Imp | Comment | |||
|---|---|---|---|---|---|---|---|---|
| R4 | 164.90 | * | 50% Jul/Aug fall | S1 | 162.00 | * | congestion | |
| R3 | 164.30 | * | Nov 2023 high | S2 | 161.00 | * | 4 Oct low | |
| R2 | 163.90 | ** | Aug high | S3 | 160.00 | * | congestion | |
| R1 | 163.60 | * | 10 Oct high | S4 | 158.10/00 | ** | 30 Sep low, congestion |
Asterisk denotes strength of level
01:00 GMT - Extending consolidation below the 163.60 high as prices unwind overbought intraday studies. However, the flag pattern suggest scope for break here to further extend gains from the September low to retest the August corrective high at 163.90. Break above the latter, if seen, will open up further extension to the 164.30 resistance and 164.90, 50% Fibonacci level. Meanwhile, support remains at the 162.00 level and this now underpin. Would take break here to ease the upside pressure and see room for pullback to retrace gains from the 158.00 level.