Published: 2024-10-14T16:56:22.000Z
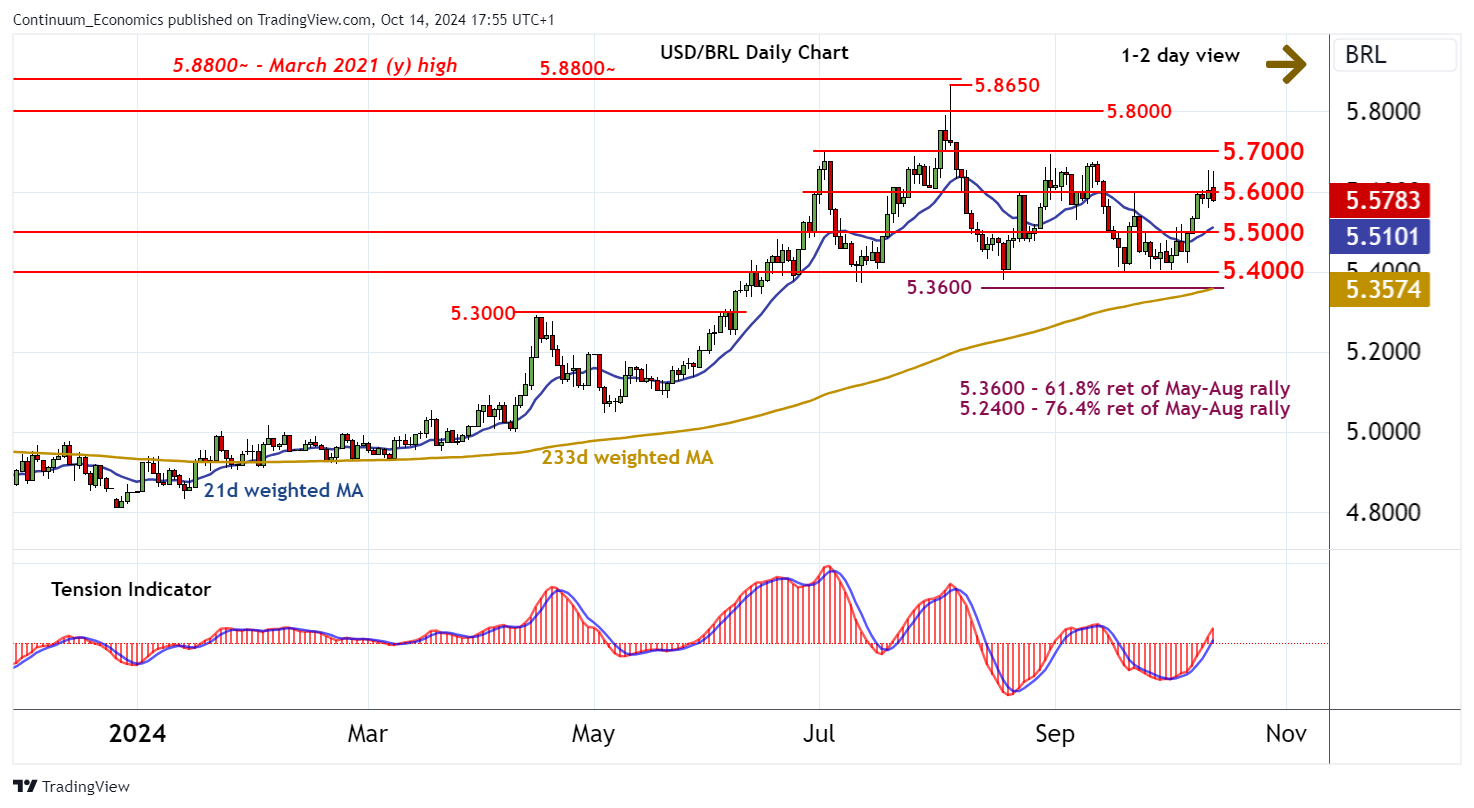
Chart USD/BRL Update: Consolidating gains - background improving

Senior Technical Strategist
-
The test above 5.6000 has been pushed back from beneath resistance at 5.7000
| Levels | Imp | Comment | Levels | Imp | Comment | |||
|---|---|---|---|---|---|---|---|---|
| R4 | 5.7000 | break level | S1 | 5.5000 | * | break level | ||
| R3 | 5.6760 | * | 12 Sep (m) high | S2 | 5.4000 | congestion | ||
| R2 | 5.6530 | * | 10 Oct (w) high | S3 | 5.3600 | ** | 61.8% ret of May-Aug rally | |
| R1 | 5.6000 | * | congestion | S4 | 5.3000 | * | break level |
Asterisk denotes strength of level
17:30 BST - The test above 5.6000 has been pushed back from beneath resistance at 5.7000, as overbought daily stochastics unwind, with prices currently trading back below 5.6000. Focus is turning to support at 5.5000, but the positive daily Tension Indicator and improving weekly charts should limit losses in renewed consolidation above here. A close beneath here, however, would add weight to sentiment and extend weakness towards strong support at 5.4000. Meanwhile, a close above 5.6000 would turn sentiment cautiously positive, and open up a test of 5.7000.