Published: 2024-10-14T14:13:30.000Z
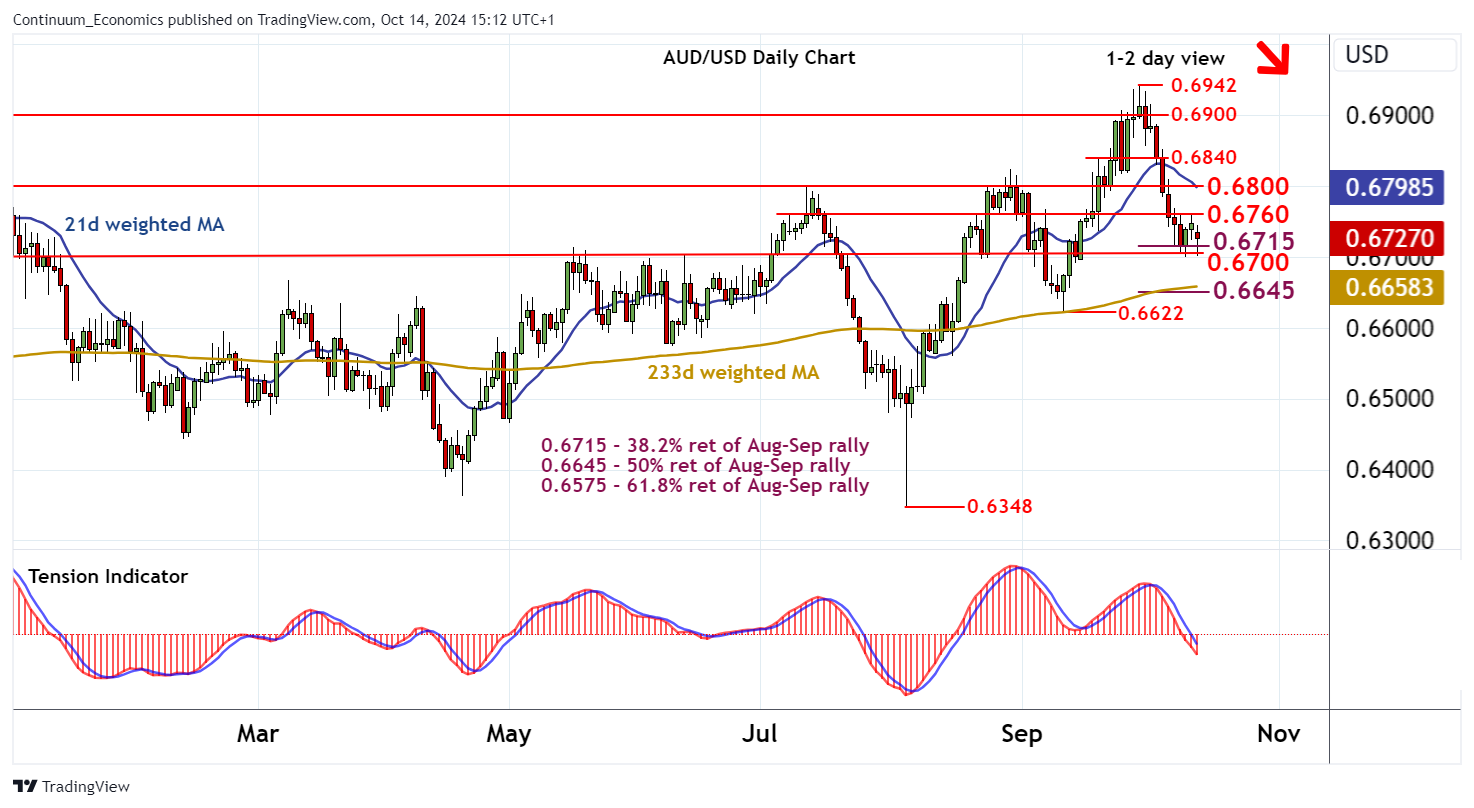
Chart AUD/USD Update: Consolidating test of 0.6700/15 - background under pressure

Senior Technical Strategist
-
Little change, as prices extend consolidation
| Levels | Imp | Comment | Levels | Imp | Comment | |||
|---|---|---|---|---|---|---|---|---|
| R4 | 0.6900 | ** | congestion | S1 | 0.6715 | ** | 38.2% ret of Aug-Sep rally | |
| R3 | 0.6840 | break level | S2 | 0.6700 | ** | congestion | ||
| R2 | 0.6800 | ** | break level | S3 | 0.6645 | ** | 50% ret of Aug-Sep rally | |
| R1 | 0.6760 | break level | S4 | 0.6622 | ** | 11 Sep (m) low |
Asterisk denotes strength of level
15:00 BST - Little change, as prices extend consolidation following the test of strong support at the 0.6715 Fibonacci retracement and congestion around 0.6700. Oversold daily stochastics are edging higher, suggesting further cautious trade, before the bearish daily Tension Indicator and negative weekly charts prompt fresh losses. A later close below 0.6700/15 will turn sentiment negative and extend September losses towards the 0.6645 retracement. Meanwhile, resistance is lowered to 0.6760. A close above here, if seen, will turn sentiment neutral and give way to consolidation beneath 0.6800.