Published: 2024-10-10T06:01:56.000Z
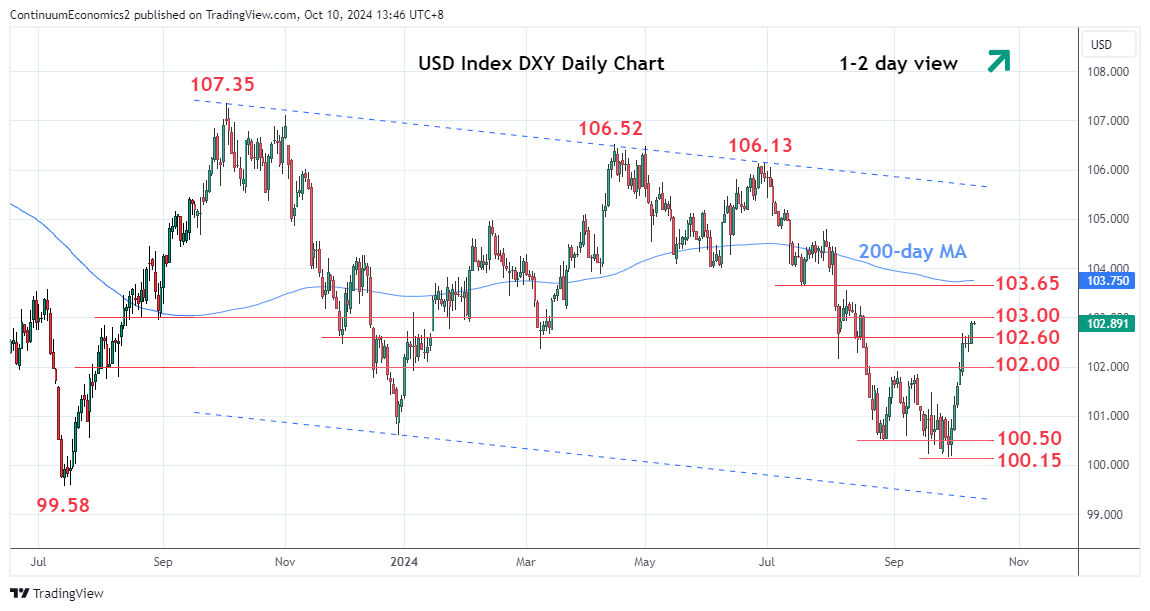
Chart USD Index DXY Update: Extending gains

Technical Analyst
-
Close above the 102.50/102.60 congestion and 38.2% Fibonacci level further extend gains from the 100.15, September YTD low
| Levels | Imp | Comment | Levels | Imp | Comment | |||
|---|---|---|---|---|---|---|---|---|
| R4 | 104.00 | ** | Jun low | S1 | 102.30 | * | 8 Oct low | |
| R3 | 103.65 | ** | Jul low | S2 | 102.00 | * | congestion | |
| R2 | 103.30 | * | 50% Apr/Sep fall | S3 | 101.50 | * | 19 Sep high | |
| R1 | 103.00 | * | congestion | S4 | 101.00 | ** | congestion |
Asterisk denotes strength of level
06:00 GMT - Close above the 102.50/102.60 congestion and 38.2% Fibonacci level further extend gains from the 100.15, September YTD low. The daily charts are still positive and suggest room to extend gains. Higher will further retrace the April/September losses to the 103.00 level then the 103.30, 50% Fibonacci retracement. However, gains are corrective and expected to give way to selling pressure later with support raised to the 102.30/102.00 area which now underpin. Break here will return focus to the downside for retest of the 100.50 and 100.15 lows.