Published: 2024-10-10T05:34:19.000Z
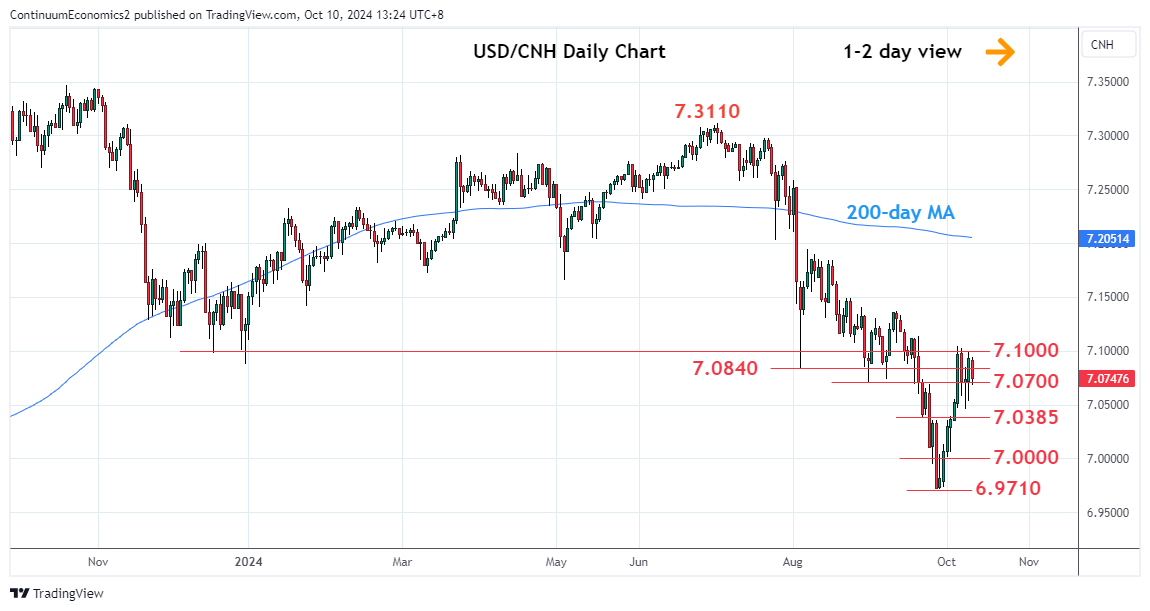
Chart USD/CNH Update: Back to pressure the 7.1000 figure

Technical Analyst
-
Bounce at the 7.0500 level see pressure returning to the upside to retest the 7.1000 resistance
| Level | Imp | Comment | Level | Imp | Comment | |||
|---|---|---|---|---|---|---|---|---|
| R4 | 7.1400/10 | * | congestion, 50% | S1 | 7.0500 | * | congestion | |
| R3 | 7.1200 | * | congestion | S2 | 7.0385 | * | 20 Sep low | |
| R2 | 7.1135 | * | 19 Sep high | S3 | 7.0000 | * | figure | |
| R1 | 7.1000 | * | 38.2% Jul/Sep fall | S4 | 6.9710 | ** | 26 Sep YTD low |
Asterisk denotes strength of level
05:30 GMT - Bounce at the 7.0500 level see pressure returning to the upside to retest the 7.1000 resistance. The resulting flag pattern suggest scope for break here to further extend gains from the September YTD low to the 7.1135 resistance then the 7.1200/7.1410 congestion area and 50% Fibonacci retracement. However, the daily studies remains stretched and caution corrective pullback. Would take break of the 7.0500 support to return focus to the downside for retest of the 7.0385 support and the 7.0000 figure.