Published: 2024-10-07T08:14:33.000Z
Chart USD Index DXY Update: Still room to extend gains

Technical Analyst
2
Sharp rally from the September YTD low has seen gains to retrace 38.2% of the April/September fall to reach 102.60
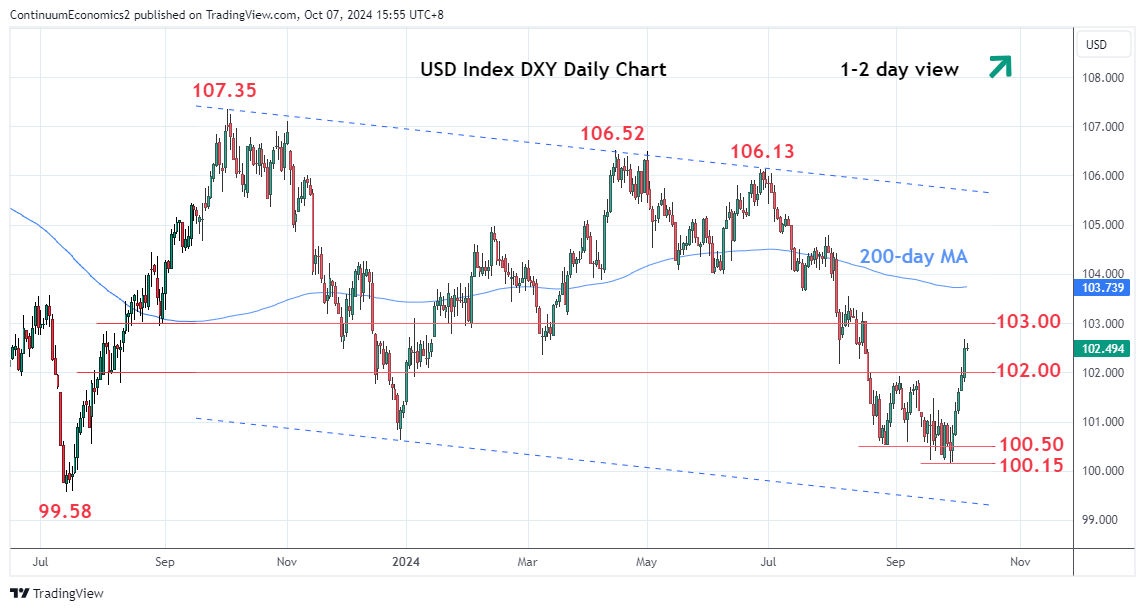
| Levels | Imp | Comment | Levels | Imp | Comment | |||
|---|---|---|---|---|---|---|---|---|
| R4 | 103.65 | ** | Jul low | S1 | 102.00 | * | congestion | |
| R3 | 103.30 | * | 50% Apr/Sep fall | S2 | 101.50 | * | break level | |
| R2 | 103.00 | * | congestion | S3 | 101.00 | ** | congestion | |
| R1 | 102.60 | * | 38.2% Apr/Sep fall | S4 | 100.50 | * | Aug low |
Asterisk denotes strength of level
08:10 GMT - Sharp rally from the September YTD low has seen gains to retrace 38.2% of the April/September fall to reach 102.60. Consolidation here see prices unwinding overbought intraday studies but the positive daily charts suggest room for further gains. Higher will see room to the 103.00 leveland 103.30, 50% Fibonacci retracement. Gains are seen corrective and expected to give way to selling pressure later. Meanwhile, support is raised to the 102.00/101.50 area. Below here will return focus to the 100.50 and 100.15 lows.