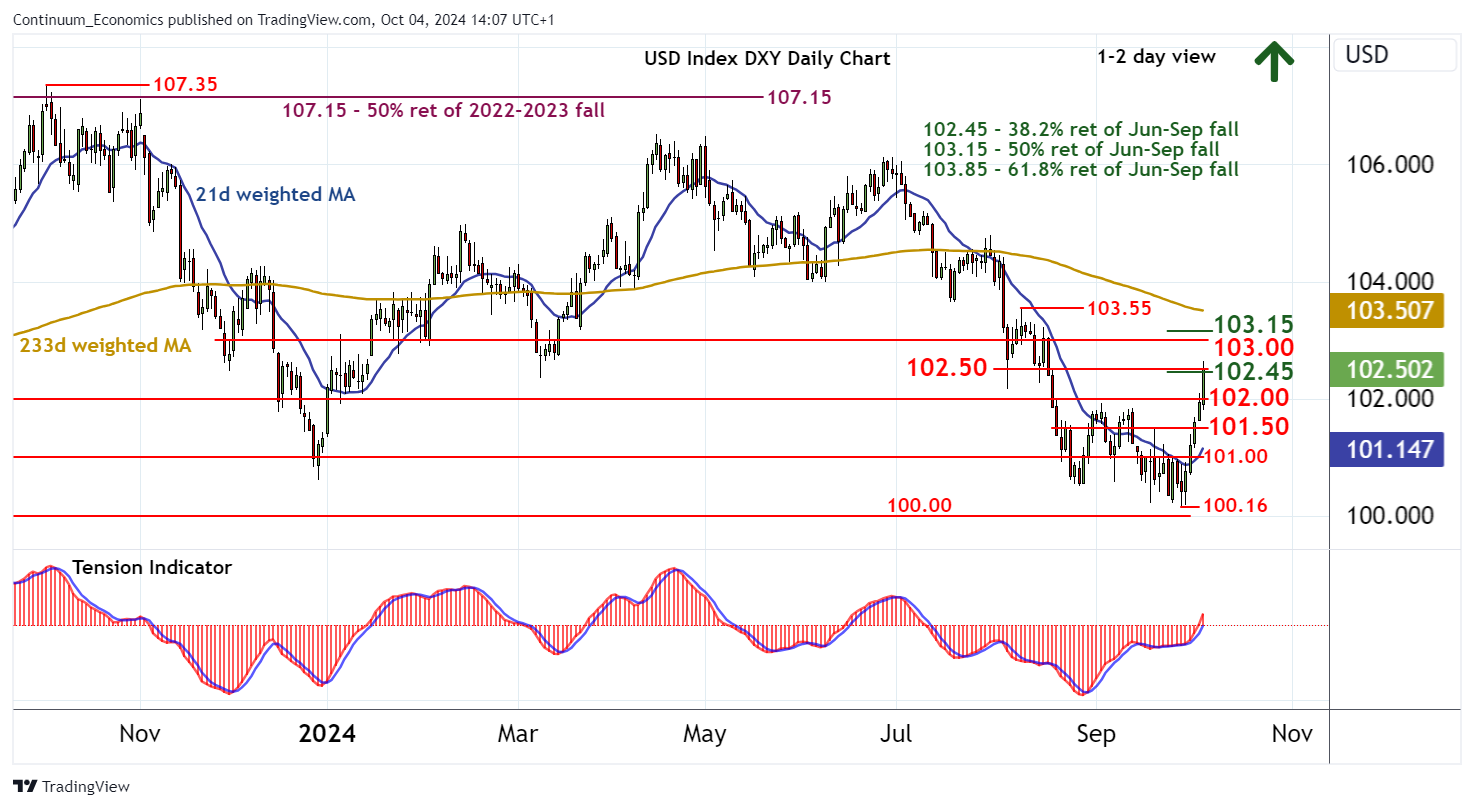
Chart USD Index DXY Update: Potential for still higher

Cautious trade around 102.00 has given way to a sharp break higher
| Levels | Imp | Comment | Levels | Imp | Comment | |||
|---|---|---|---|---|---|---|---|---|
| R4 | 103.55 | * | 8 Aug (w) high | S1 | 102.00 | * | congestion | |
| R3 | 103.15 | ** | 50% ret of Jun-Sep fall | S2 | 101.50 | break level | ||
| R2 | 103.00 | ** | congestion | S3 | 101.00 | ** | congestion | |
| R1 | 102.45/50 | ** | 38.2% ret; congestion | S4 | 100.16 | ** | 27 Sep YTD low |
Asterisk denotes strength of level
13:55 BST - Cautious trade around 102.00 has given way to a sharp break higher, with prices currently testing levels just above resistance at 102.45/50. Intraday studies are mixed and daily stochastics are overbought, suggesting fresh consolidation around here. However, the positive daily Tension Indicator and improving weekly charts point to room for still further gains, with congestion resistance at 103.00 and the 103.15 Fibonacci retracement to attract. This latter area could limit any initial tests in more significant profit-taking/consolidation. Meanwhile, support is raised to congestion around 102.00. A close beneath here, if seen, will turn sentiment neutral and prompt consolidation above 101.50.