Published: 2024-10-03T13:05:21.000Z
Chart USD Index DXY Update: Extending gains

Senior Technical Strategist
1
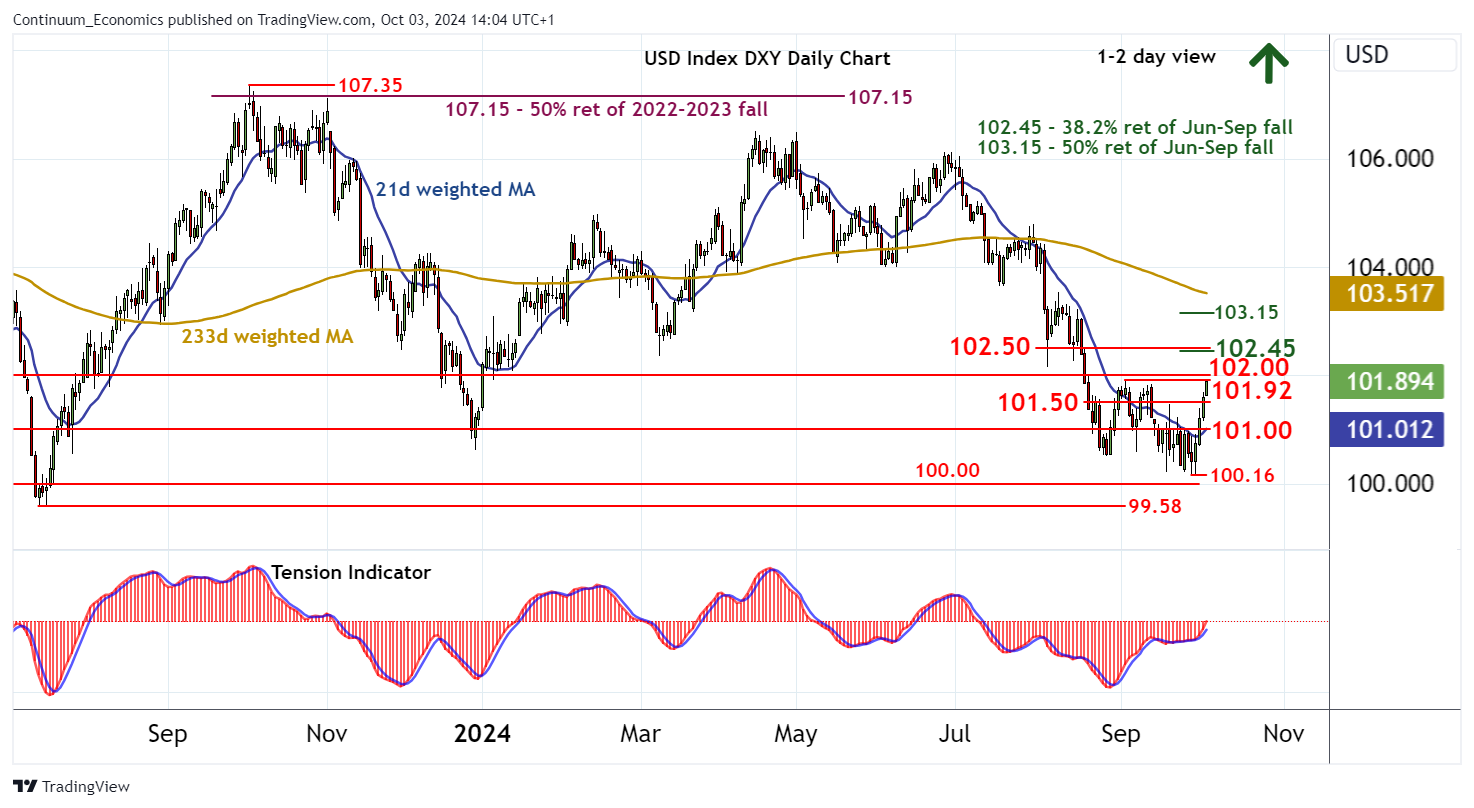
Cautious trade around 101.50 has given way to anticipated gains
| Levels | Imp | Comment | Levels | Imp | Comment | |||
|---|---|---|---|---|---|---|---|---|
| R4 | 103.00/15 | * | congestion; 50% ret | S1 | 101.50 | break level | ||
| R3 | 102.50 | congestion | S2 | 101.00 | ** | congestion | ||
| R2 | 102.45 | ** | 38.2% ret of Jun-Sep fall | S3 | 100.16 | ** | 27 Sep YTD low | |
| R1 | 101.92/00 | ** | 3 Sep (m) high; congestion | S4 | 100.00 | ** | congestion |
Asterisk denotes strength of level
13:45 BST - Cautious trade around 101.50 has given way to anticipated gains, with prices currently pressuring critical resistance at the 101.92 monthly high of 3 September and congestion around 102.00. Daily readings continue to rise and broader weekly charts are improving, highlighting room for further strength in the coming sessions. A close above here would confirm a significant low in place at the 100.16 current year low of 27 September and open up a test of the 102.45 Fibonacci retracement and congestion around 102.50. Meanwhile, congestion support at 101.00 should underpin any immediate tests below 101.50.