Published: 2024-10-03T10:07:36.000Z
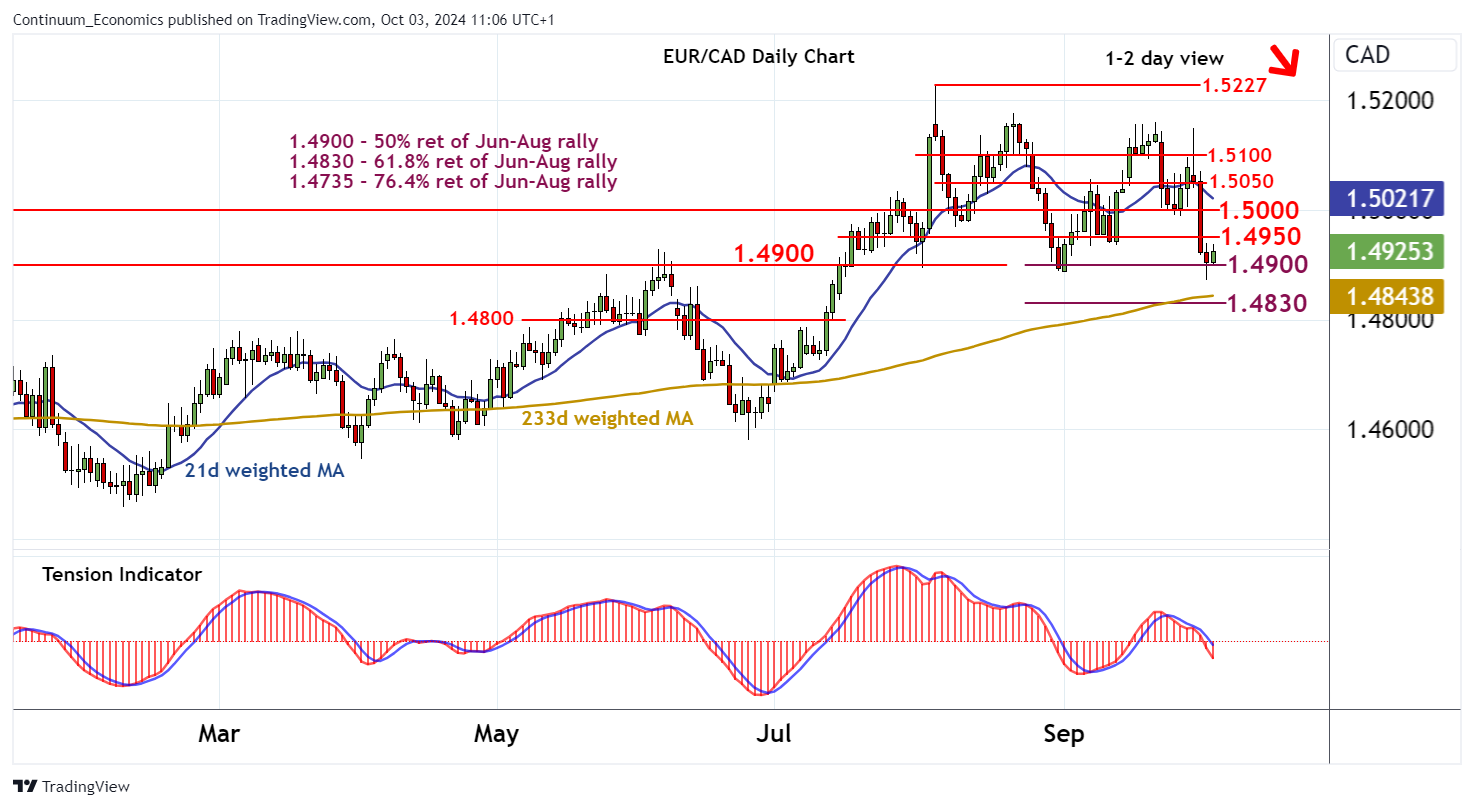
Chart EUR/CAD Update: Consolidating test below 1.4900 - studies remain under pressure

Senior Technical Strategist
-
The anticipated break below the 1.4900 Fibonacci retracement ahs bounced smartly from 1.4875
| Level | Comment | Level | Comment | |||||
|---|---|---|---|---|---|---|---|---|
| R4 | 1.5100 | * | break level | S1 | 1.4900 | ** | 50% ret of Jun-Aug rally | |
| R3 | 1.5050 | break level | S2 | 1.4875 | 2 Oct low | |||
| R2 | 1.5000 | * | congestion | S3 | 1.4830 | ** | 61.8% ret of Jun-Aug rally | |
| R1 | 1.4950 | congestion | S4 | 1.4800 | * | congestion |
Asterisk denotes strength
10:50 BST - The anticipated break below the 1.4900 Fibonacci retracement ahs bounced smartly from 1.4875, as oversold intraday studies unwind, with prices trading back above 1.4900. Focus is turning to congestion resistance at 1.4950, but negative daily readings and deteriorating weekly charts should limit any tests in renewed selling interest. In the coming sessions cautious trade is expected to give way to fresh losses. A later close below 1.4900 will complete a distribution top beneath the 1.5227 current year high of 5 August and confirm continuation of August losses, initially to the 1.4830 retracement.