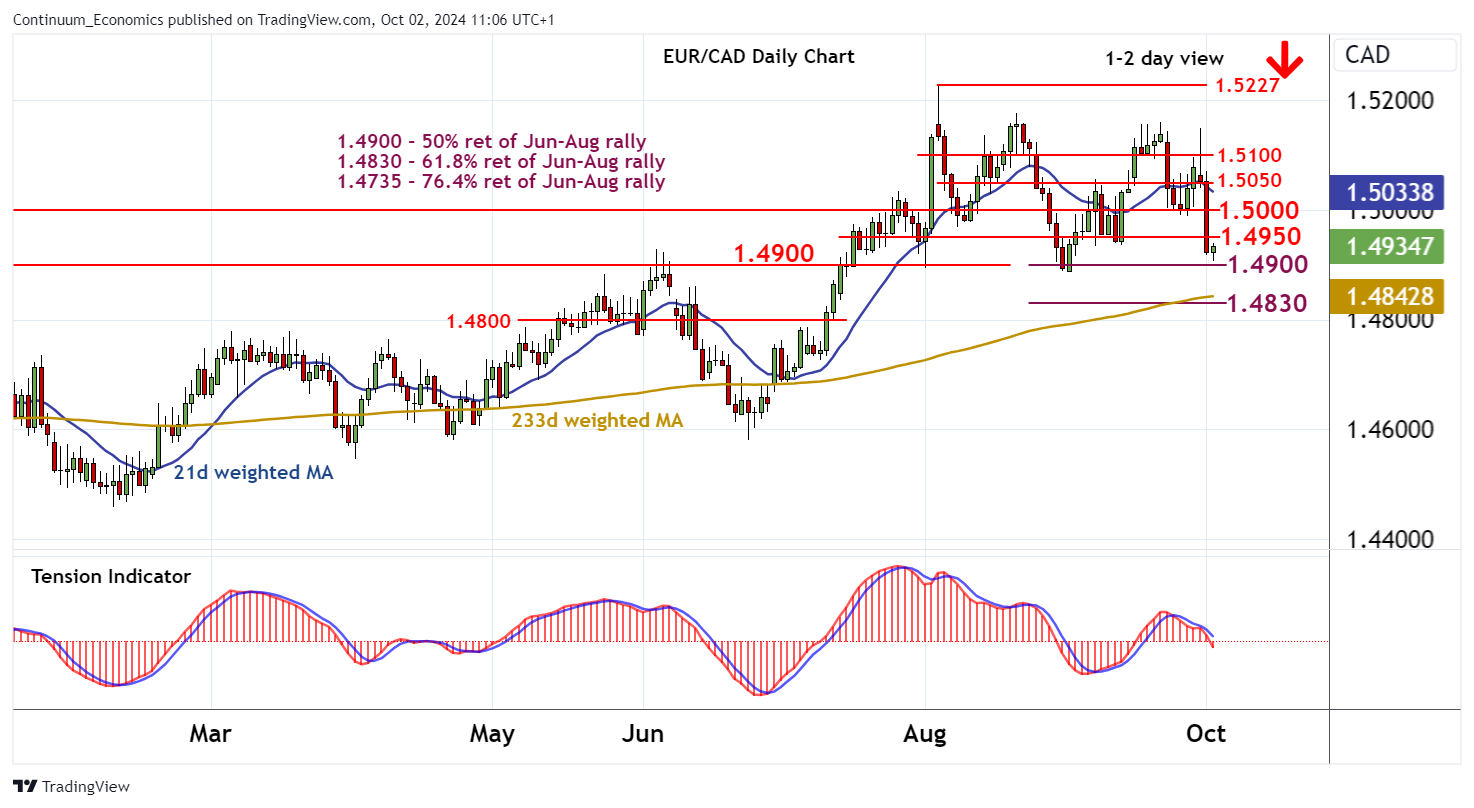
Chart EUR/CAD Update: Potential for deeper losses

Anticipated losses are finding support just above critical support at the 1.4890~ monthly low of 2 September and the 1.4900 Fibonacci retracement
| Level | Comment | Level | Comment | |||||
|---|---|---|---|---|---|---|---|---|
| R4 | 1.5100 | * | break level | S1 | 1.4900 | ** | 50% ret of Jun-Aug rally | |
| R3 | 1.5050 | break level | S2 | 1.4890~ | ** | 2 Sep (m) low | ||
| R2 | 1.5000 | * | congestion | S3 | 1.4830 | ** | 61.8% ret of Jun-Aug rally | |
| R1 | 1.4950 | congestion | S4 | 1.4800 | * | congestion |
Asterisk denotes strength
10:45 BST - Anticipated losses are finding support just above critical support at the 1.4890~ monthly low of 2 September and the 1.4900 Fibonacci retracement, as oversold intraday studies unwind. Consolidation is developing, but negative daily readings and a tick lower in weekly charts highlight room for further losses in the coming sessions. A close beneath here will complete a distribution top and confirm continuation of August losses, initially to the 1.4830 retracement. Meanwhile, resistance is lowered to congestion around 1.4950. A close above here, if seen, would stabilise price action and give way to consolidation beneath further congestion around 1.5000.