Published: 2024-10-02T07:42:37.000Z
Chart EUR/USD Update: Prices remain under pressure

Senior Technical Strategist
1
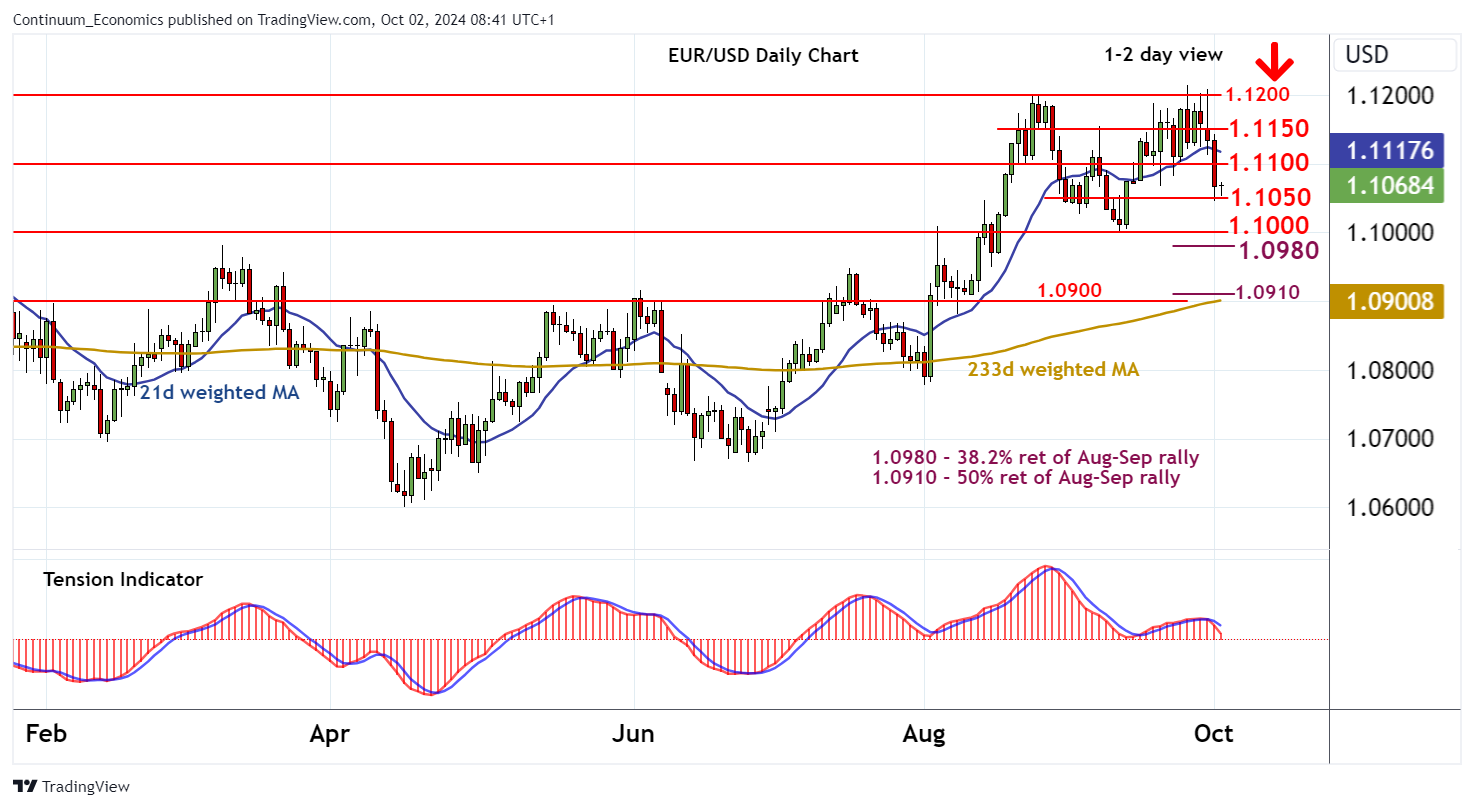
Anticipated losses have reached congestion support at 1.1050
| Levels | Imp | Comment | Levels | Imp | Comment | |||
|---|---|---|---|---|---|---|---|---|
| R4 | 1.1275 | ** | 61.8% ret of 2021-2022 fall, Jul 2023 (y) high | S1 | 1.1050 | congestion | ||
| R3 | 1.1200/15 | ** | break level, 25 Sep YTD high | S2 | 1.1000 | ** | congestion | |
| R2 | 1.1150 | break level | S3 | 1.0980 | ** | 38.2% ret of Aug-Sep rally | ||
| R1 | 1.1100 | * | congestion | S4 | 1.0900/10 | ** | break level; 50% ret of Aug-Sep rally |
Asterisk denotes strength of level
08:30 BST - Anticipated losses have reached congestion support at 1.1050, where oversold intraday studies are prompting short-term reactions. Daily readings continue to track lower and broader weekly charts are also under pressure, highlighting a bearish tone and room for further losses in the coming sessions. A close below 1.1050 will open up strong support at the 1.0980 Fibonacci retracement and congestion around 1.1000. A further close beneath here will confirm completion of a distribution top and open up 1.0900/10. Meanwhile, a close above 1.1100, if seen, will turn sentiment neutral and give way to consolidation beneath 1.1150.