Published: 2024-10-01T13:38:08.000Z
Chart USD Index DXY Update: Edging higher, but gains to remain limited

Senior Technical Strategist
2
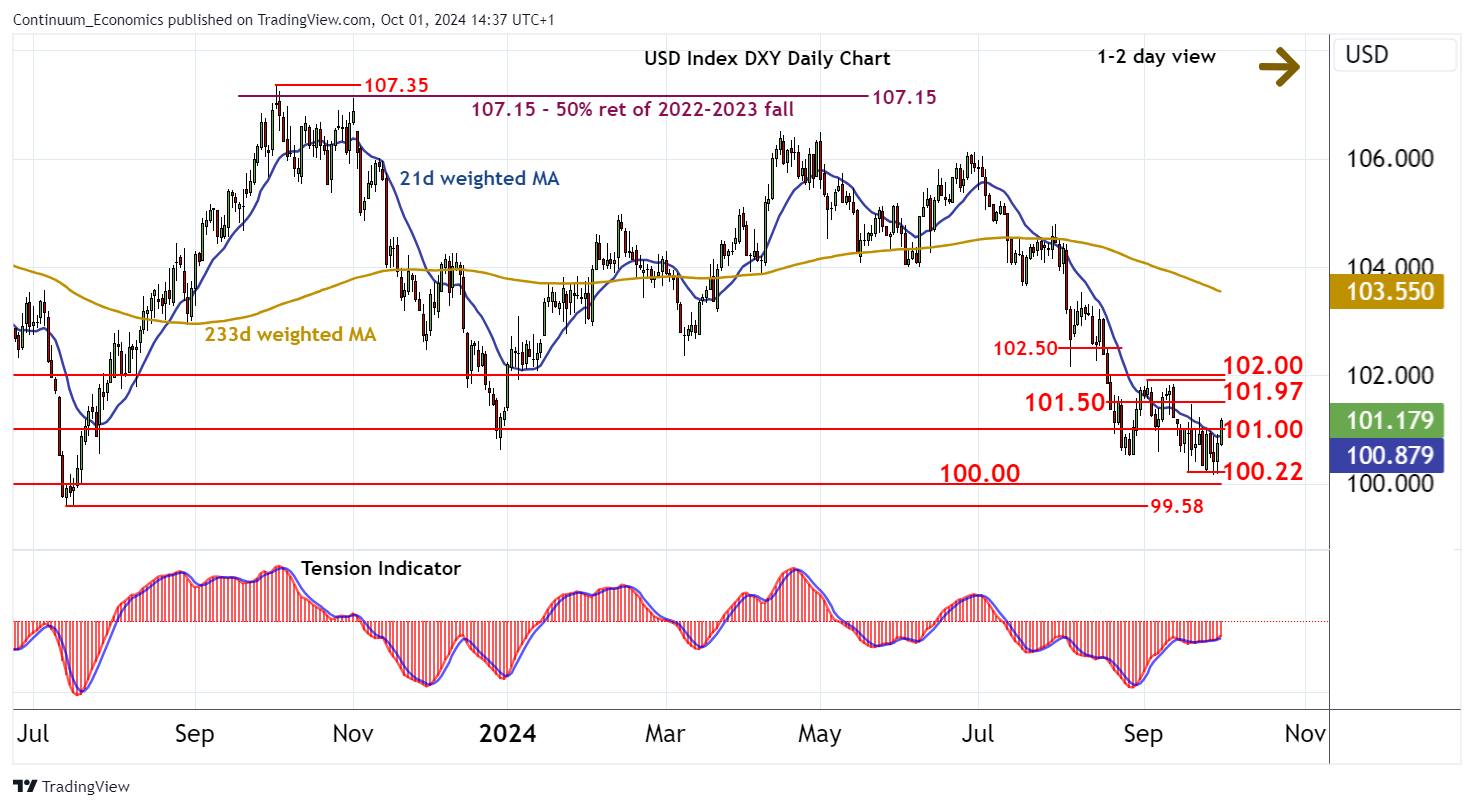
Consolidation following the test of strong support at the 100.22 current year low of 18 September is giving way to a test higher
| Levels | Imp | Comment | Levels | Imp | Comment | |||
|---|---|---|---|---|---|---|---|---|
| R4 | 103.00 | * | congestion | S1 | 101.00 | ** | congestion | |
| R3 | 102.50 | congestion | S2 | 100.22 | ** | 18 Sep YTD low | ||
| R2 | 101.97/00 | ** | 3 Sep high; congestion | S3 | 100.00 | ** | congestion | |
| R1 | 101.50 | break level | S4 | 99.58 | ** | July 2023 (y) low |
Asterisk denotes strength of level
14:20 BST - Consolidation following the test of strong support at the 100.22 current year low of 18 September is giving way to a test higher, with prices currently trading above 101.00. Intraday studies are rising and daily readings have turned positive, suggesting an improvement in price action and room for continuation higher. Resistance is at 101.50, but mixed weekly charts should limit any initial tests above here in renewed selling interest beneath 101.97/00. Meanwhile, any immediate tests back below 101.00 should give way to consolidation above 100.00/22.