Published: 2024-10-01T06:08:20.000Z
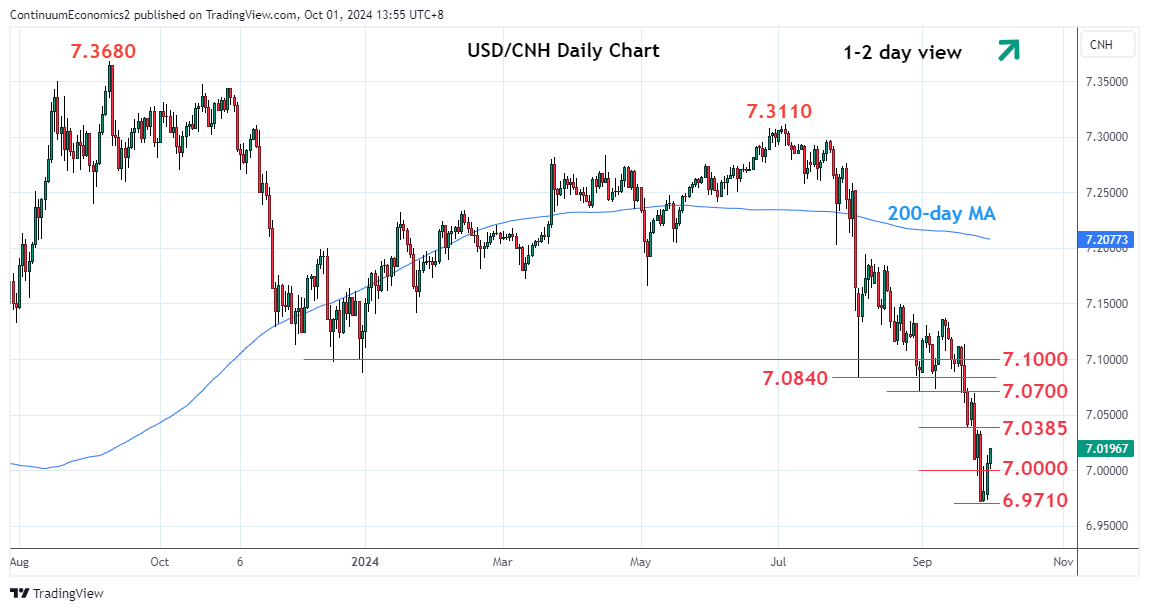
Chart USD/CNH Update: Extending corrective bounce from 6.9710 low

Technical Analyst
-
Extending bounce from the 6.9710 to retrace the September losses from 7.1365 high
| Level | Imp | Comment | Level | Imp | Comment | |||
|---|---|---|---|---|---|---|---|---|
| R4 | 7.1000 | ** | figure, congestion | S1 | 7.0000 | * | figure | |
| R3 | 7.0840 | * | 5 Aug low | S2 | 6.9710 | ** | 26 Sep YTD low | |
| R2 | 7.0700 | * | 30 Aug low, congestion | S3 | 6.9650 | * | 2 May 2023 high | |
| R1 | 7.0385 | * | 20 Sep low | S4 | 6.9550 | * | 50% 2023 rally |
Asterisk denotes strength of level
06:10 GMT - Extending bounce from the 6.9710 to retrace the September losses from 7.1365 high. Regaining the 7.0000 figure see room for stronger gains to to unwind the deep oversold intraday and daily studies. Higher see room for stronger bounce to resistance at the 7.0700/7.0840 previous lows, then the 7.1000 level which is expected to cap. Correction is expected to give way to renewed selling pressure. Below the 7.0000 level return focus to the 6.9710 low and where break will see extension to the 6.9550, 50% Fibonacci retracement of the 2023 rally.