Chart USD/CAD Update: Gains to remain limited

The anticipated test above 1.3500 has met selling interest around 1.3525
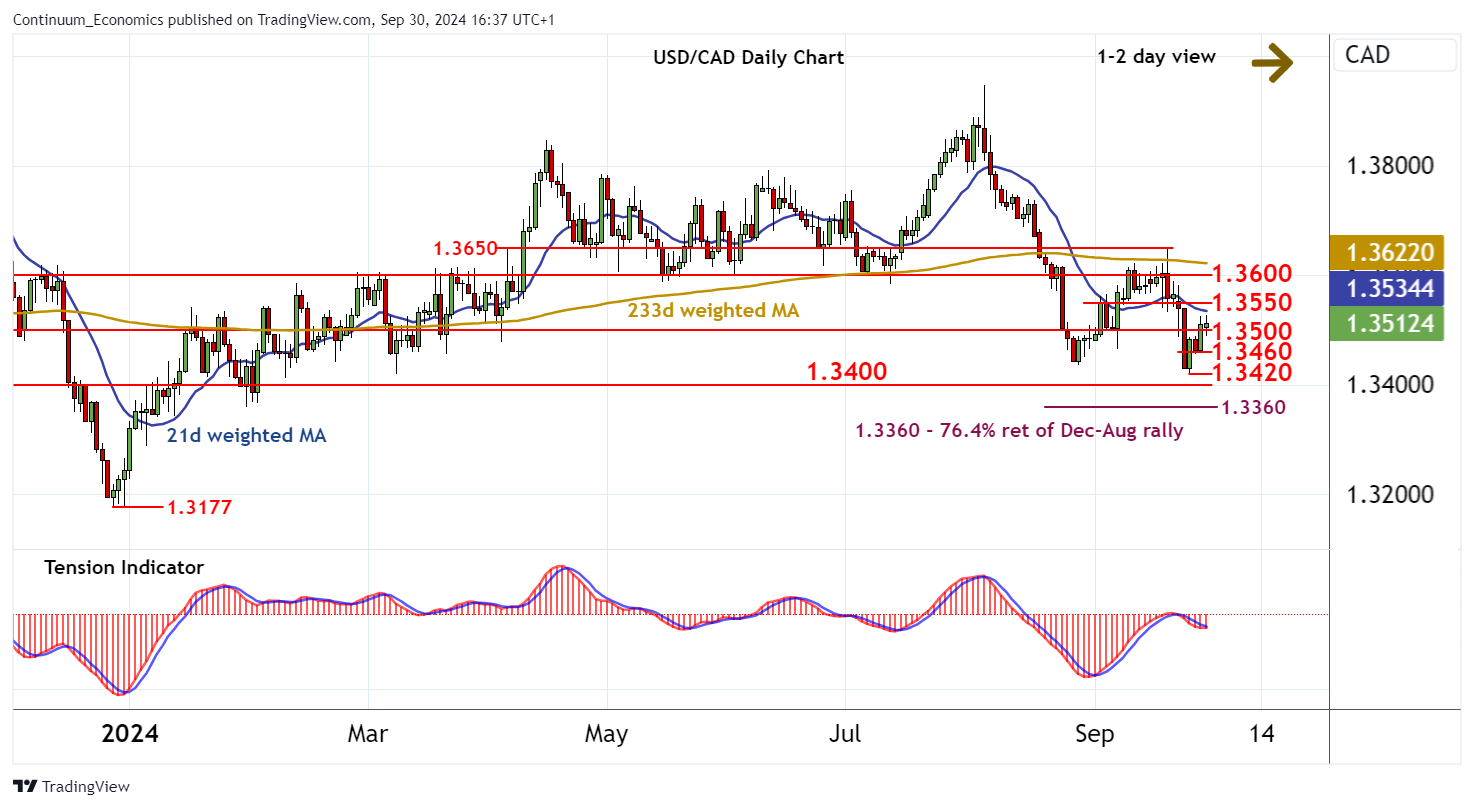
| Levels | Imp | Comment | Levels | Imp | Comment | |||
|---|---|---|---|---|---|---|---|---|
| R4 | 1.3630 | ** | 38.2% ret of Aug fall | S1 | 1.3500 | * | congestion | |
| R3 | 1.3600 | ** | break level | S2 | 1.3460 | * | intraday break level | |
| R2 | 1.3550 | intraday break level | S3 | 1.3420 | 25 Sep (w) low | |||
| R1 | 1.3525 | intraday high | S4 | 1.3400 | ** | break level |
Asterisk denotes strength of level
16:20 BST - The anticipated test above 1.3500 has met selling interest around 1.3525, as intraday studies unwind areas, with prices currently balanced in cautious trade above 1.3500. Daily readings are edging higher, suggesting potential for a test of resistance at 1.3550. But deteriorating weekly charts are expected to prompt renewed selling interest towards here. Following corrective trade, fresh losses are looked for. Support is at 1.3500 and extends to 1.3460. However, a close below the 1.3420 weekly low of 25 September is needed to turn sentiment negative and confirm a significant top in place at the 1.3945~ current year high of 5 August, as focus then turns to 1.3400. Still lower is the 1.3360 Fibonacci retracement.
I,Mike Macdonald, the Senior Technical Strategist declare that the views expressed herein are mine and are clear, fair and not misleading at the time of publication. They have not been influenced by any relationship, either a personal relationship of mine or a relationship of the firm, to any entity described or referred to herein nor to any client of Continuum Economics nor has any inducement been received in relation to those views. I further declare that in the preparation and publication of this report I have at all times followed all relevant Continuum Economics compliance protocols including those reasonably seeking to prevent the receipt or misuse of material non-public information.