Chart USD Index DXY Update: Consolidating - studies under pressure

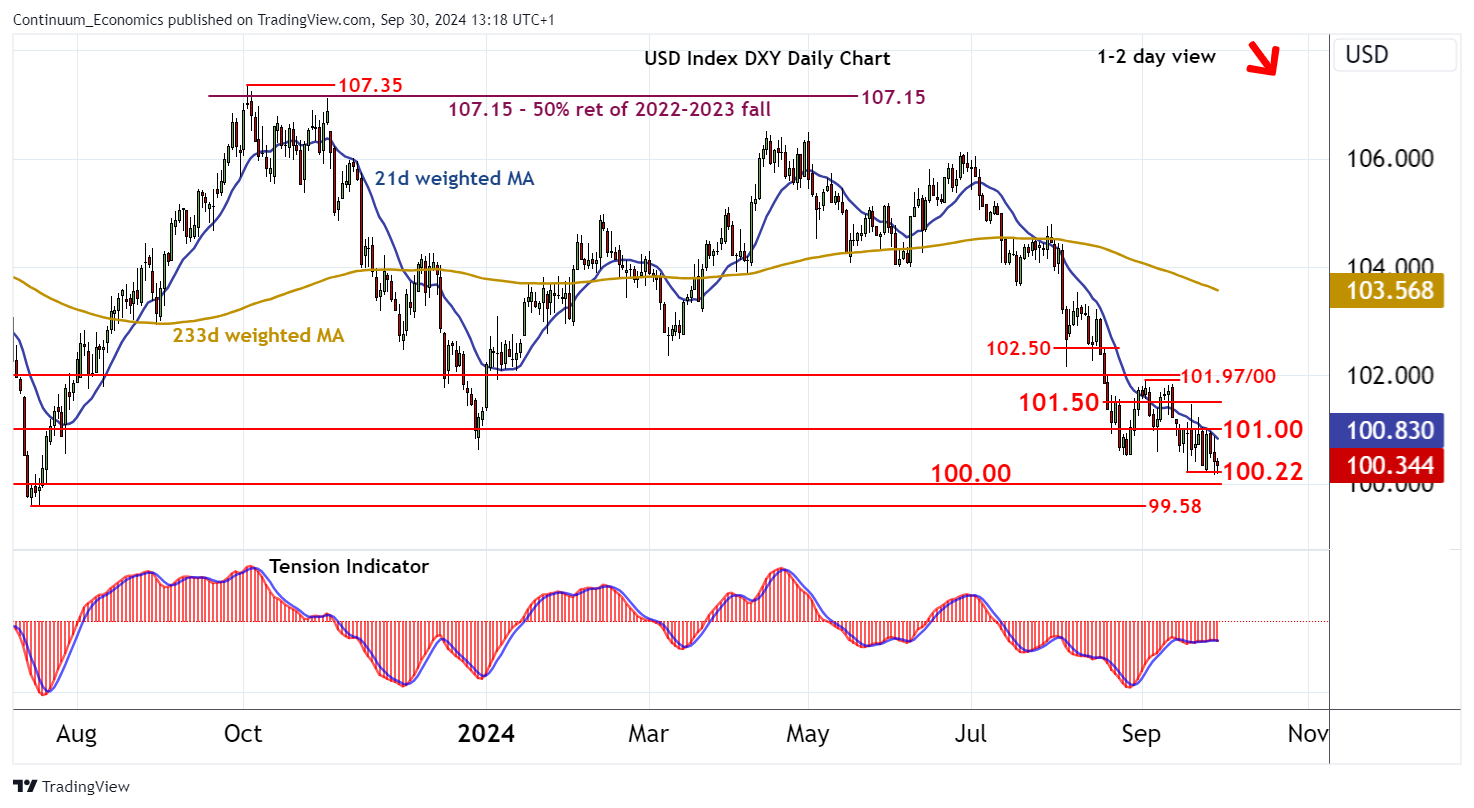
Cautious trade has given way to a test of strong support at the 100.22 current year low of 18 September
| Levels | Imp | Comment | Levels | Imp | Comment | |||
|---|---|---|---|---|---|---|---|---|
| R4 | 102.50 | congestion | S1 | 100.22 | ** | 18 Sep YTD low | ||
| R3 | 101.97/00 | ** | 3 Sep high; congestion | S2 | 100.00 | ** | congestion | |
| R2 | 101.50 | break level | S3 | 99.58 | ** | July 2023 (y) low | ||
| R1 | 101.00 | ** | congestion | S4 | 99.00 | ** | 61.8% ret of 2021-2022 rally |
Asterisk denotes strength of level
13:00 BST - Cautious trade has given way to a test of strong support at the 100.22 current year low of 18 September, where flattening oversold intraday studies are prompting fresh consolidation. Daily readings are coming under pressure once again and broader weekly charts are negative, highlighting potential for a later break beneath here. A close below 100.22 will add weight to sentiment and extend losses from the 107.35 high of October 2023 below congestion support at 100.00 towards critical multi-month support at the 99.58 year low of July 2023. Meanwhile, congestion resistance at 101.00 should cap any immediate tests higher.