Published: 2024-09-27T12:59:34.000Z
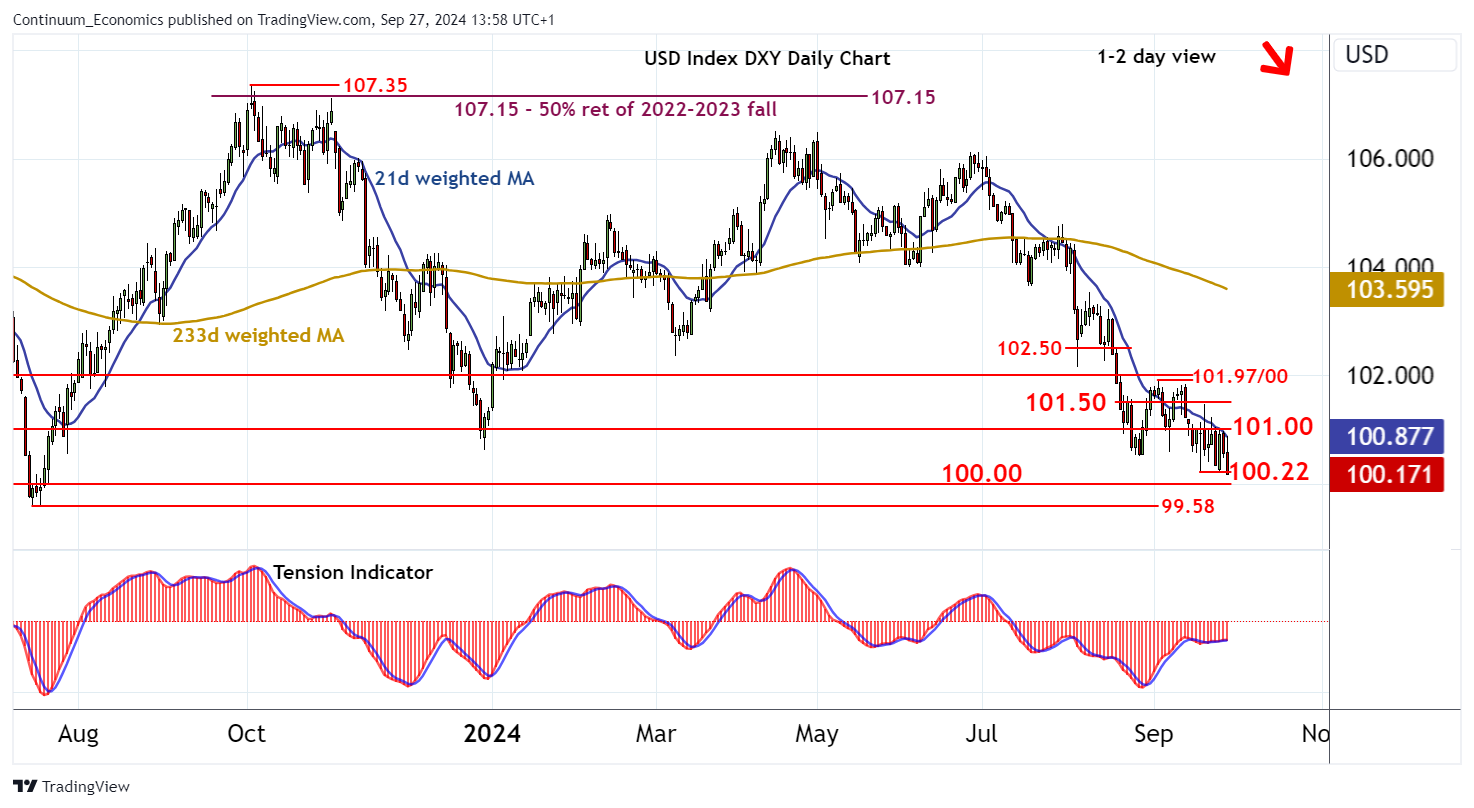
Chart USD Index DXY Update: Under pressure

Senior Technical Strategist
-
Cautious trade is giving way to fresh selling interest
| Levels | Imp | Comment | Levels | Imp | Comment | |||
|---|---|---|---|---|---|---|---|---|
| R4 | 102.50 | congestion | S1 | 100.22 | ** | 18 Sep YTD low | ||
| R3 | 101.97/00 | ** | 3 Sep high; congestion | S2 | 100.00 | ** | congestion | |
| R2 | 101.50 | break level | S3 | 99.58 | ** | July 2023 (y) low | ||
| R1 | 101.00 | ** | congestion | S4 | 99.00 | ** | 61.8% ret of 2021-2022 rally |
Asterisk denotes strength of level
13:50 BST - Cautious trade is giving way to fresh selling interest, as intraday studies turn down, with prices once again pressuring support at the 100.22 current year low of 18 September. Daily stochastics are rising, suggesting fresh consolidation around here, before a tick lower in the daily Tension Indicator and negative weekly charts prompt a break. Losses from the 107.35 high of October 2023 will then extend below congestion support at 100.00 towards critical multi-month support at the 99.58 year low of July 2023. Meanwhile, congestion resistance at 101.00 should cap any immediate tests higher.