Chart EUR/USD Update: Choppy below 2024 high - daily studies leaning lower

Little change, as prices extend choppy trade around resistance at 1.1150
| Levels | Imp | Comment | Levels | Imp | Comment | |||
|---|---|---|---|---|---|---|---|---|
| R4 | 1.1300 | * | congestion | S1 | 1.1100 | * | congestion | |
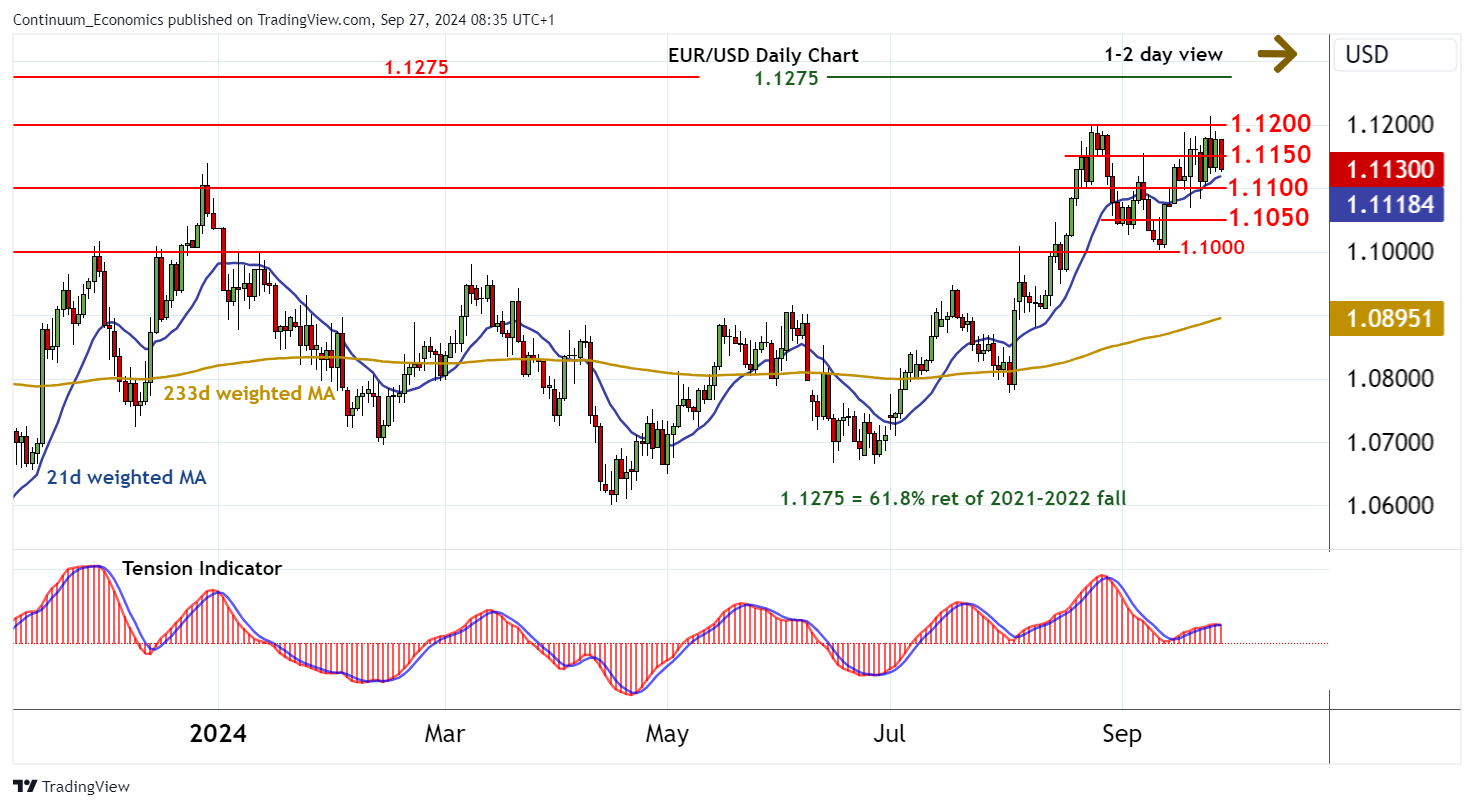
| R3 | 1.1275 | ** | 61.8% ret of 2021-2022 fall, Jul 2023 (y) high | S2 | 1.1050 | congestion | ||
| R2 | 1.1200/15 | ** | break level, 25 Sep YTD high | S3 | 1.1000 | ** | congestion | |
| R1 | 1.1150 | intraday break level | S4 | 1.0950 | * | break level |
Asterisk denotes strength of level
08:30 BST - Little change, as prices extend choppy trade around resistance at 1.1150. Daily stochastics are turning down and the daily Tension Indicator is also under pressure, highlighting room for a pullback towards congestion support at 1.1100. A break will open up further congestion around 1.1050, but mixed weekly charts are expected to limit any tests of here in renewed buying interest/consolidation. Meanwhile, critical resistance remains up to 1.1200/05. A close above here, not yet seen, will turn sentiment positive and confirm continuation of October 2023 gains towards critical multi-month resistance at the 1.1275 Fibonacci retracement and year high of July 2023.