Published: 2024-09-27T02:51:54.000Z
Chart USD/THB Update: Extending losses

Technical Analyst
1
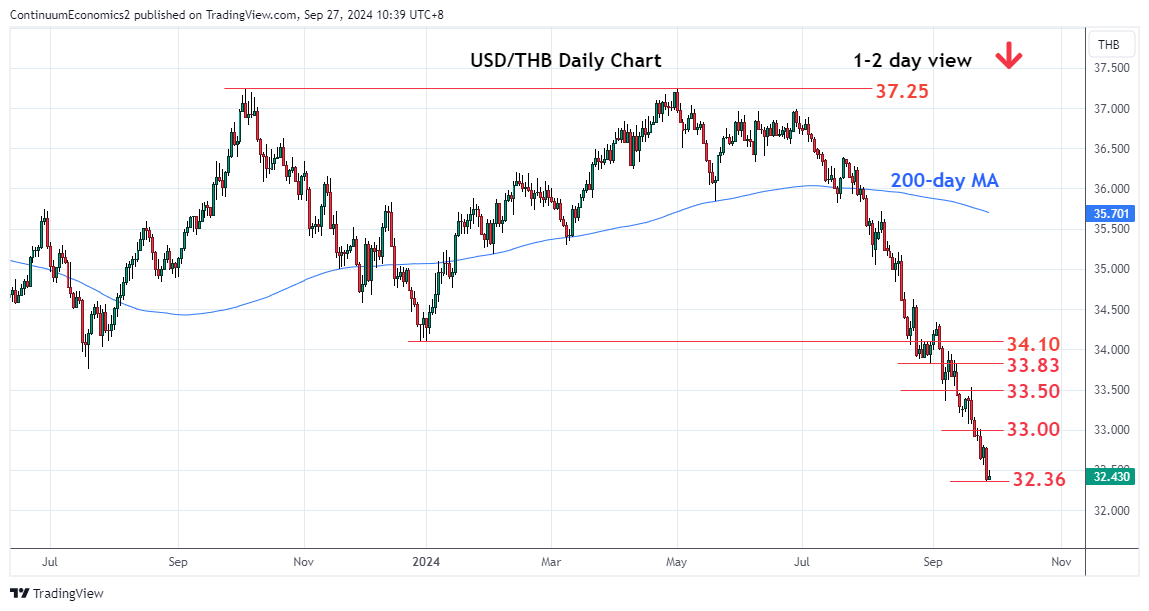
Break of the 2023 year low at 32.56 further extend the broader losses from October 2022 multi-year high
| Level | Comment | Level | Comment | |||||
|---|---|---|---|---|---|---|---|---|
| R4 | 33.83 | * | Aug low | S1 | 32.36 | * | 26 Sep low | |
| R3 | 33.50 | * | congestion | S2 | 32.20 | * | congestion | |
| R2 | 33.00/15 | * | congestion, 16 Sep low | S3 | 32.08 | ** | Feb 2022 year low | |
| R1 | 32.80 | * | 25 Sep high | S4 | 32.00 | * | figure |
Asterisk denotes strength of level
02:50 GMT - Break of the 2023 year low at 32.56 further extend the broader losses from October 2022 multi-year high to reach 32.36 low. Daily studies while stretched are still tracking lower and keep pressure on the downside. Lower will see room to the 32.20 congestion with potential now seen for retest of the 2022 year low at 32.08. Meanwhile, resistance is lowered to 32.80 then the 33.00/33.15 area. Would need to clear this to open up room for stronger bounce to correct the losses from the 37.00, June high, to the 33.50 resistance.