Published: 2024-09-26T02:48:55.000Z
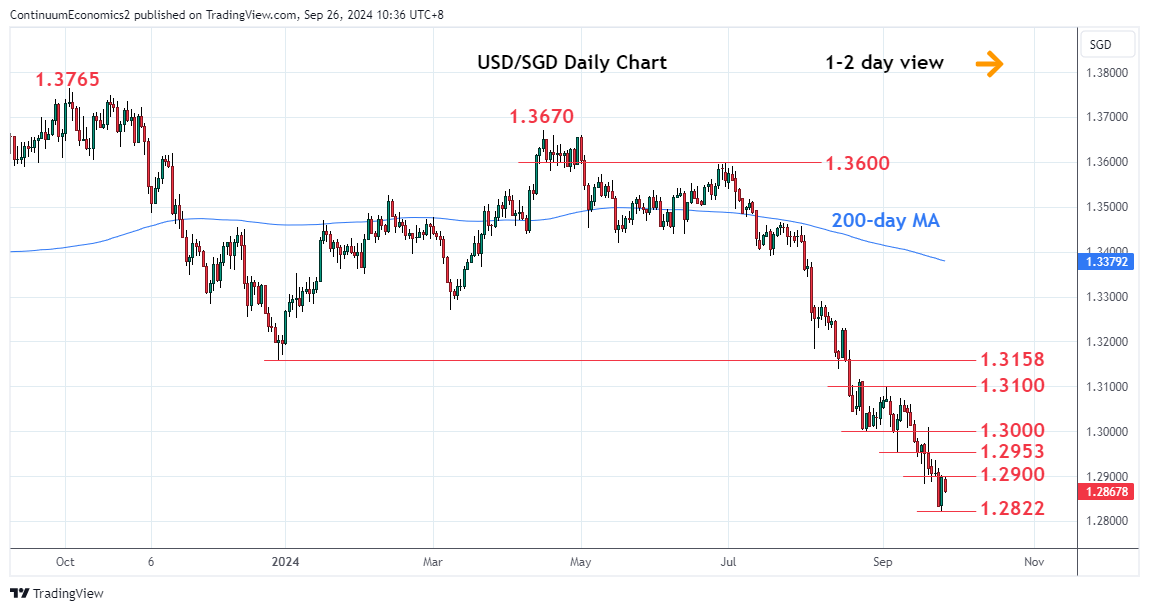
Chart USD/SGD Update: Turned up in consolidation from 1.2822, fresh year low

Technical Analyst
1
Further losses reached fresh year low at 1.2822 before turning up in consolidation to unwind oversold intraday studies
| Level | Comment | Level | Comment | |||||
|---|---|---|---|---|---|---|---|---|
| R4 | 1.3074 | * | 9 Sep high | S1 | 1.2822 | ** | 25 Sep YTD low | |
| R3 | 1.3000 | ** | figure, Aug low | S2 | 1.2775 | * | 24 Oct 2014 high | |
| R2 | 1.2953 | * | 6 Sep low | S3 | 1.2706 | * | 29 Oct 2014 low | |
| R1 | 1.2883/00 | * | 18 Sep low, congestion | S4 | 1.2677 | * | 9 Oct 2014 month low |
Asterisk denotes strength of level
02:40 GMT - Further losses reached fresh year low at 1.2822 before turning up in consolidation to unwind oversold intraday studies to reach the resistance at the 1.2883/1.2900 area. Daily studies are stretched as well and suggest scope for stronger bounce to correct losses from the 1.3100 level. Higher will see scope to resistance at the 1.2953 then the 1.3000 level. Corrective bounce expected to give way to fresh selling pressure later and break of the 1.2822 low and 1.2800 level will further extend the broader losses from the 2020 year high.