Chart USD/CAD Update: Limited bounce from fresh 2024 year low

The anticipated test of the 1.3436 monthly low of 28 August has extended to post a fresh 2024 year low around 1.3420
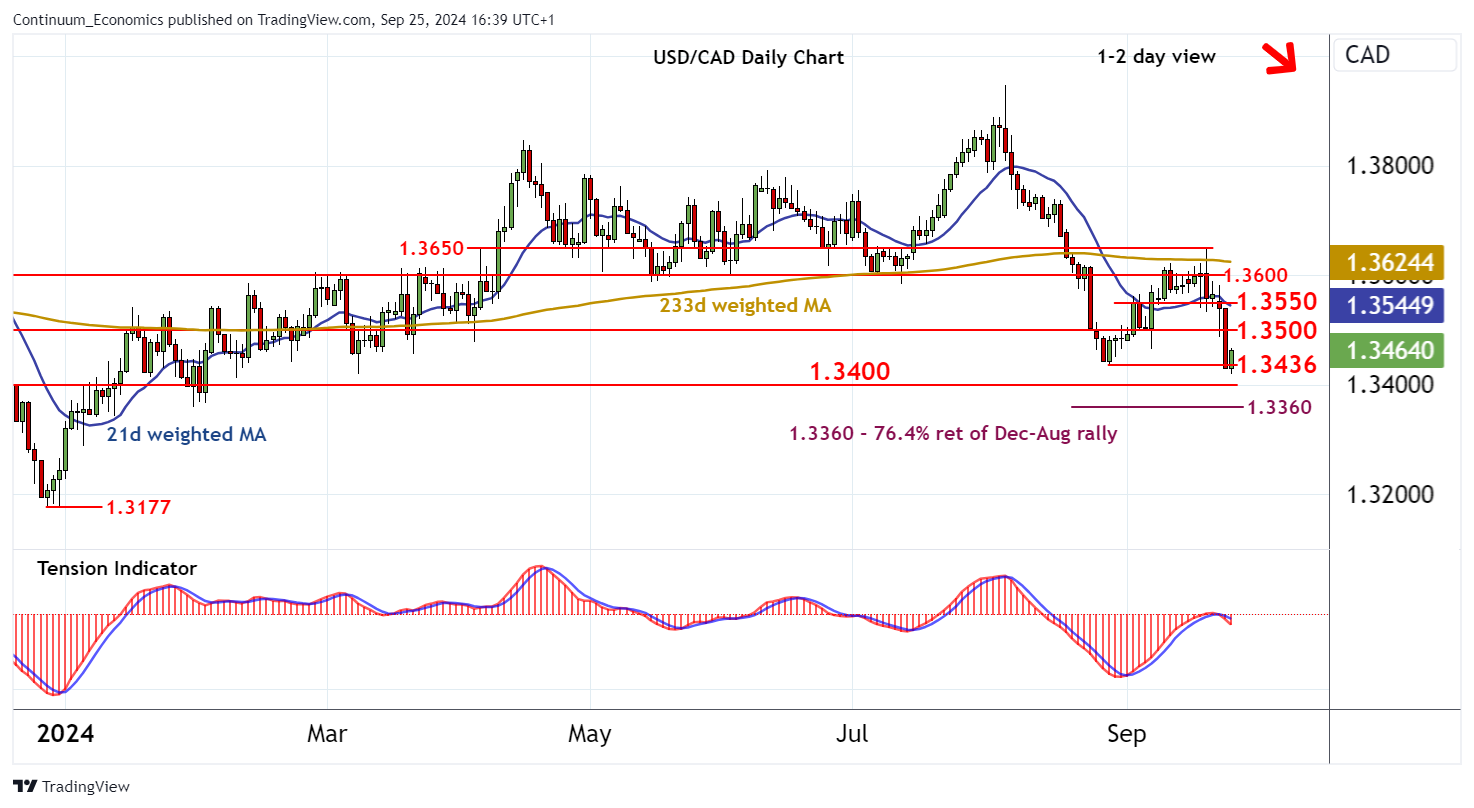
| Levels | Imp | Comment | Levels | Imp | Comment | |||
|---|---|---|---|---|---|---|---|---|
| R4 | 1.3630 | ** | 38.2% ret of Aug fall | S1 | 1.3436 | ** | 28 Aug (m) low | |
| R3 | 1.3600 | ** | break level | S2 | 1.3420 | current year low | ||
| R2 | 1.3550 | intraday break level | S3 | 1.3400 | ** | break level | ||
| R1 | 1.3500 | * | congestion | S4 | 1.3360 | ** | 76.4% ret of Dec-Aug rally |
Asterisk denotes strength of level
16:30 BST - The anticipated test of the 1.3436 monthly low of 28 August has extended to post a fresh 2024 year low around 1.3420, before bouncing smartly to trade back above 1.3436. Unwinding oversold intraday studies highlight potential for continuation towards congestion resistance at 1.3500. But negative daily readings and bearish weekly charts are expected to prompt renewed selling interest towards here. Following corrective trade, fresh losses are looked for. A later close below 1.3420/36 will turn sentiment negative and confirm a significant top in place at the 1.3945~ current year high of 5 August, as focus then turns to 1.3400. Beneath here is the 1.3360 Fibonacci retracement.
I,Mike Macdonald, the Senior Technical Strategist declare that the views expressed herein are mine and are clear, fair and not misleading at the time of publication. They have not been influenced by any relationship, either a personal relationship of mine or a relationship of the firm, to any entity described or referred to herein nor to any client of Continuum Economics nor has any inducement been received in relation to those views. I further declare that in the preparation and publication of this report I have at all times followed all relevant Continuum Economics compliance protocols including those reasonably seeking to prevent the receipt or misuse of material non-public information.