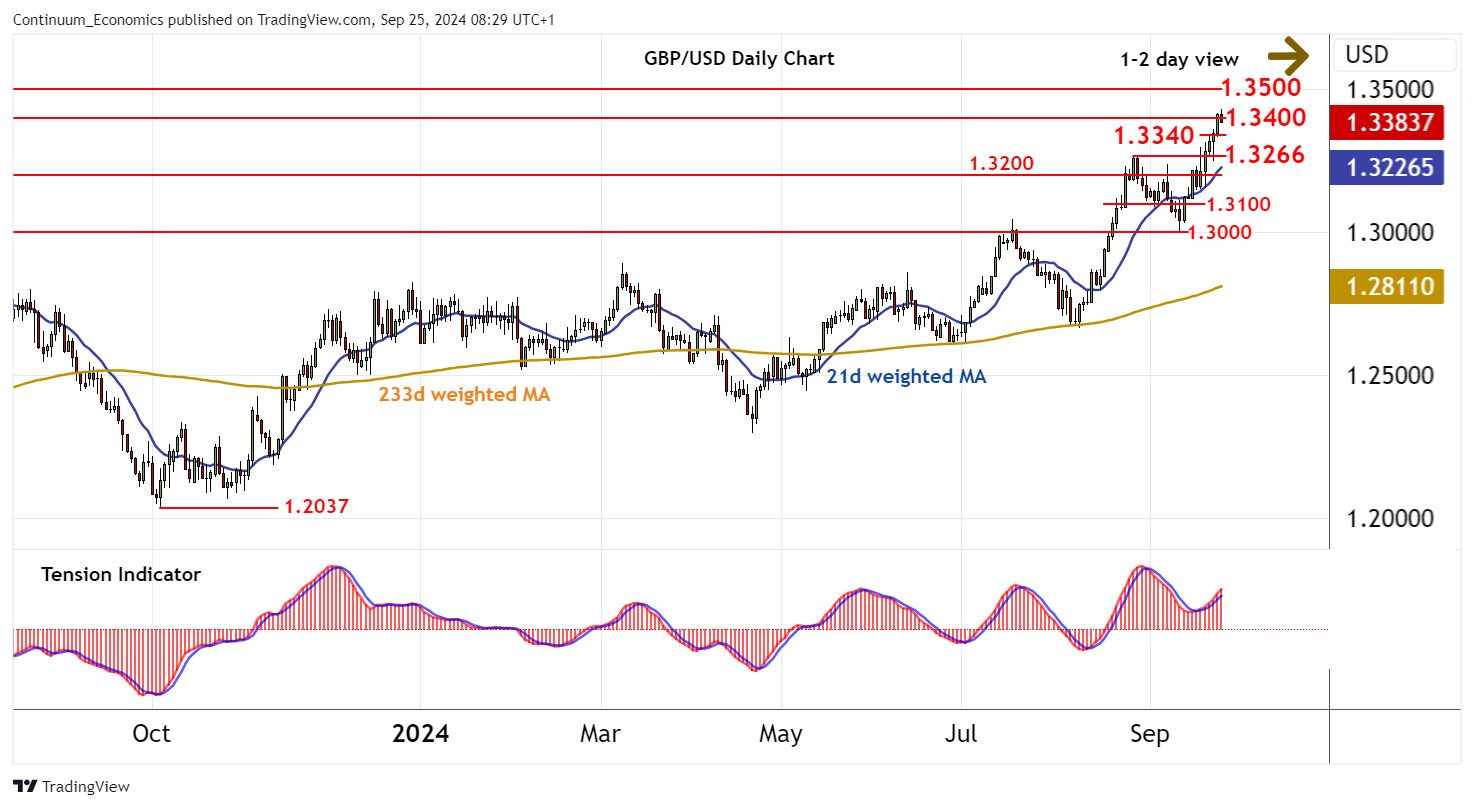
Chart GBP/USD Update: Turning away from fresh 2024 year high above 1.3400

The anticipated test of resistance at 1.3400 has extended to a fresh 2024 year high at 1.3430
| Level | Comment | Level | Comment | |||||
|---|---|---|---|---|---|---|---|---|
| R4 | 1.3600 | * | congestion | S1 | 1.3340 | * | intraday break level | |
| R3 | 1.3500 | ** | congestion | S2 | 1.3266 | * | 27 Aug (m) high | |
| R2 | 1.3430 | current year high | S3 | 1.3200 | * | congestion | ||
| R1 | 1.3400 | * | break level | S4 | 1.3150 | intraday break level |
Asterisk denotes strength of level
08:05 BST - The anticipated test of resistance at 1.3400 has extended to a fresh 2024 year high at 1.3430, where unwinding overbought intraday studies are prompting profit-taking and a break back below 1.3400. Overbought daily stochastics are also flattening, suggesting a drift lower towards support at 1.3340. A break cannot be ruled out, but the positive daily Tension Indicator and rising weekly charts are expected to prompt renewed buying interest towards the 1.3266 monthly high of 27 August. Meanwhile, a close above 1.3430, not yet seen, will turn sentiment positive once again and extend September 2022 gains towards 1.3500.