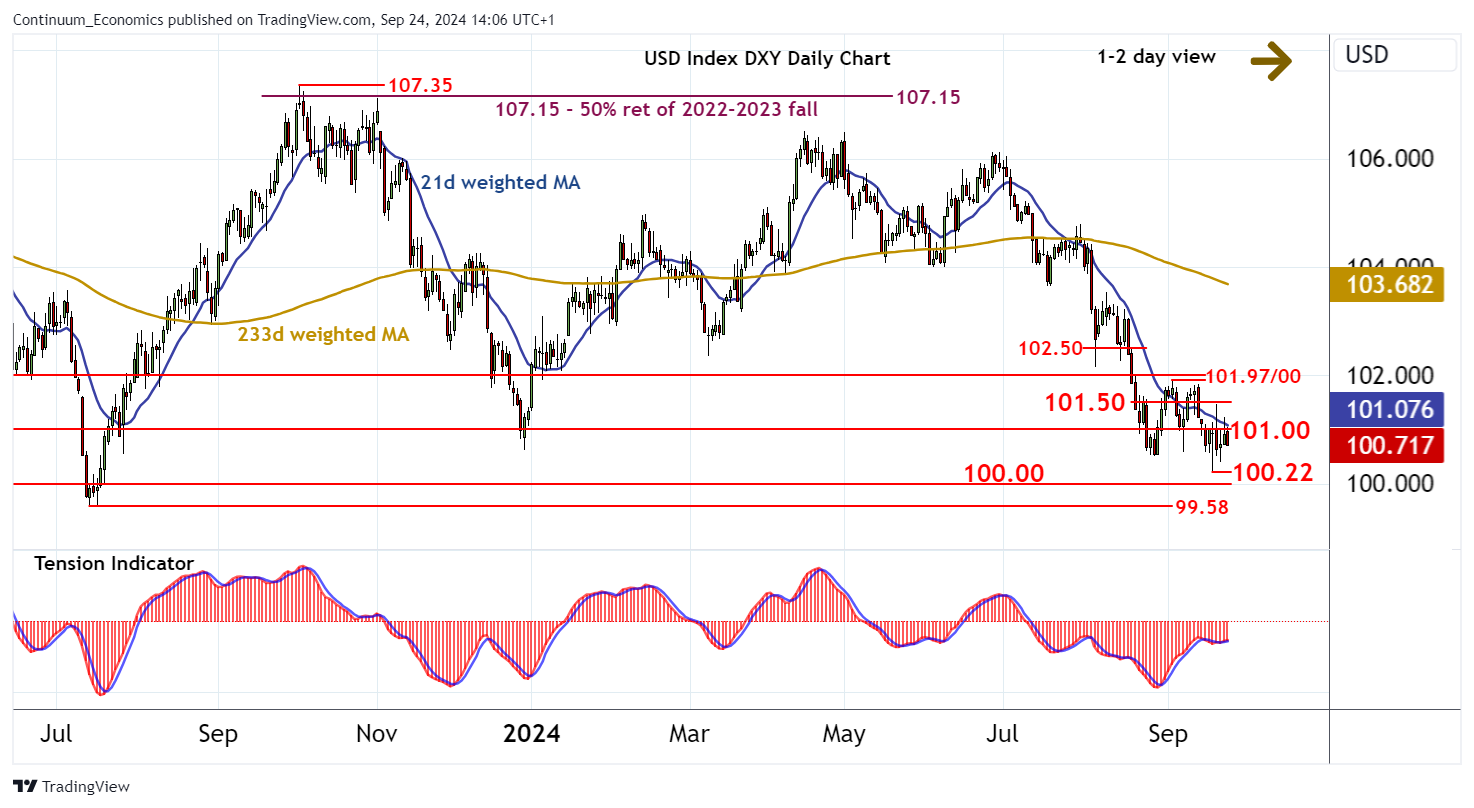
Chart USD Index DXY Update: Choppy trade - daily studies leaning lower

Little change, as prices extend cautious trade beneath congestion resistance at 101.00
| Levels | Imp | Comment | Levels | Imp | Comment | |||
|---|---|---|---|---|---|---|---|---|
| R4 | 102.50 | congestion | S1 | 100.22 | ** | 18 Sep YTD low | ||
| R3 | 101.97/00 | ** | 3 Sep high; congestion | S2 | 100.00 | ** | congestion | |
| R2 | 101.50 | break level | S3 | 99.58 | ** | July 2023 (y) low | ||
| R1 | 101.00 | ** | congestion | S4 | 99.00 | ** | 61.8% ret of 2021-2022 rally |
Asterisk denotes strength of level
13:55 BST - Little change, as prices extend cautious trade beneath congestion resistance at 101.00. Intraday studies are under pressure, highlighting room for a pullback. But rising daily stochastics and the improving daily Tension Indicator are expected to limit initial scope in consolidation above support at the 100.82 current year low of 18 September. Broader weekly charts are under pressure, however, highlighting potential for a later break beneath here and extension of October 2023 losses below congestion support at 100.00 towards critical multi-month support at the 99.58 year low of July 2023. Meanwhile, any fresh tests above 101.00 should meet selling interest beneath 101.50.