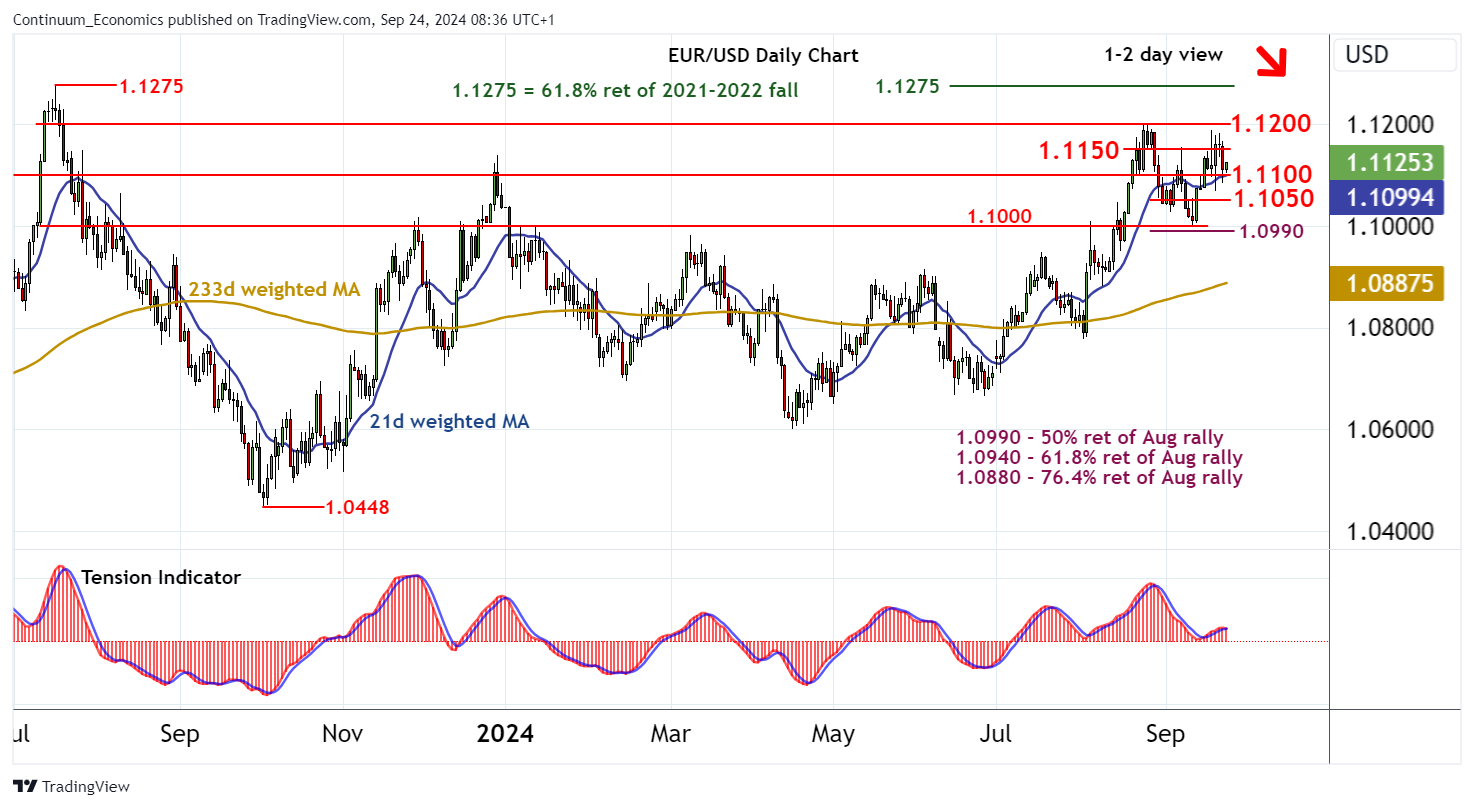
Chart EUR/USD Update: Balanced above 1.1100 - daily studies under pressure

The test below congestion support at 1.1100 has bounced from 1.1080/85
| Levels | Imp | Comment | Levels | Imp | Comment | |||
|---|---|---|---|---|---|---|---|---|
| R4 | 1.1300 | * | congestion | S1 | 1.1100 | * | congestion | |
| R3 | 1.1275 | ** | 61.8% ret of 2021-2022 fall | S2 | 1.1050 | congestion | ||
| R2 | 1.1200 | ** | break level, 23-24 Aug YTD high | S3 | 1.0990/00 | ** | 50% ret of August rally; congestion | |
| R1 | 1.1150 | intraday break level | S4 | 1.0940 | ** | 61.8% ret of August rally |
Asterisk denotes strength of level
08:30 BST - The test below congestion support at 1.1100 has bounced from 1.1080/85, as intraday studies turn flat, with prices once again trading above 1.1100. Overbought daily stochastics are turning down and the daily Tension Indicator is coming under pressure, highlighting room for a fresh break beneath here towards congestion around 1.1050. However, weekly charts are mixed/positive, suggesting any initial tests could give way to fresh consolidation/buying interest. Meanwhile, initial resistance remains at 1.1150. But a close above 1.1200 is needed to turn sentiment positive once again and extend October 2023 gains towards critical multi-month resistance at the 1.1275 Fibonacci retracement.