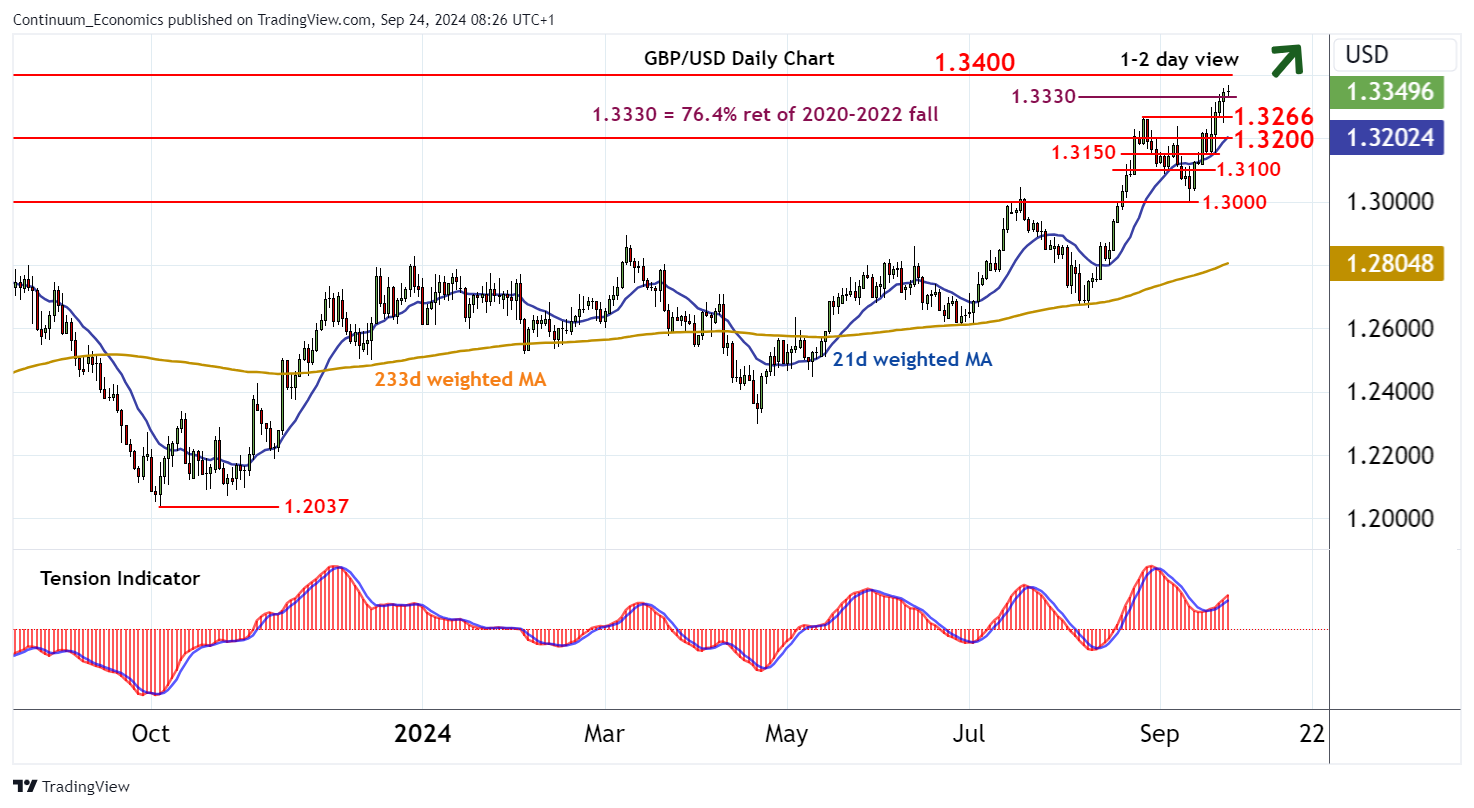
Chart GBP/USD Update: Fresh 2024 year highs - focus on 1.3400

The minor pullback from the 1.3330 Fibonacci retracement has met fresh buying interest just beneath the 1.3266 monthly high of 27 August
| Level | Comment | Level | Comment | |||||
|---|---|---|---|---|---|---|---|---|
| R4 | 1.3645 | * | Feb 2022 (m) high | S1 | 1.3266 | * | 27 Aug (m) high | |
| R3 | 1.3600 | * | congestion | S2 | 1.3200 | * | congestion | |
| R2 | 1.3500 | ** | congestion | S3 | 1.3150 | intraday break level | ||
| R1 | 1.3400 | * | break level | S4 | 1.3100 | intraday break level |
Asterisk denotes strength of level
08:05 BST - The minor pullback from the 1.3330 Fibonacci retracement has met fresh buying interest just beneath the 1.3266 monthly high of 27 August, with steady gains currently trading at fresh 2024 year highs around 1.3350. Focus is on resistance at 1.3400, but positive intraday studies and overbought daily stochastics are flattening, suggesting any initial tests could give way to fresh consolidation. The daily Tension Indicator is positive, however, and broader weekly charts are also rising, pointing to room for a later break and extension of September 2022 gains towards 1.3500. Meanwhile, a close below 1.3266 would turn sentiment neutral and prompt consolidation above congestion support at 1.3200.