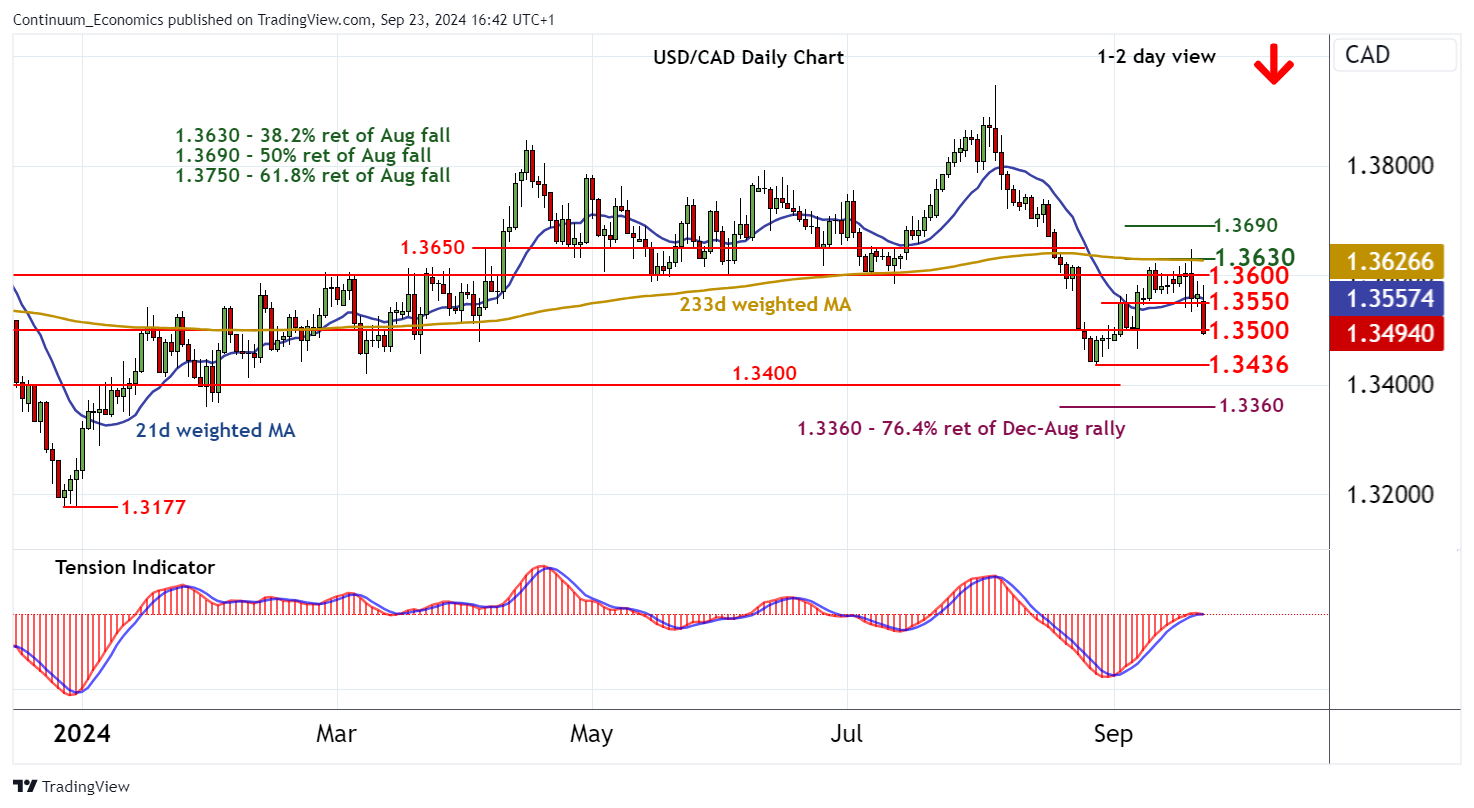
Chart USD/CAD Update: Under pressure in CAD-driven trade

Cautious trade has given way to a break lower in CAD-driven trade
| Levels | Imp | Comment | Levels | Imp | Comment | |||
|---|---|---|---|---|---|---|---|---|
| R4 | 1.3648/50 | * | 19 Sep high; pivot | S1 | 1.3500 | * | congestion | |
| R3 | 1.3630 | ** | 38.2% ret of Aug fall | S2 | 1.3465 | * | 6 Sep (w) low | |
| R2 | 1.3600 | ** | break level | S3 | 1.3436 | ** | 28 Aug (m) low | |
| R1 | 1.3550 | intraday break level | S4 | 1.3400 | ** | break level |
Asterisk denotes strength of level
16:30 BST - Cautious trade has given way to a break lower in CAD-driven trade, with prices currently pressuring congestion support at 1.3500. Intraday studies have turned down and daily readings remain under pressure, highlighting room for further losses in the coming sessions. A break below 1.3500 will add weight to negative sentiment and open up critical support support at the 1.3465 weekly low of 6 September. Broader weekly charts are also coming under pressure, but a close beneath here would confirm a significant top in place at the 1.3945~ current year high of 5 August, and open up 1.3400. Meanwhile, a close back above 1.3550 would turn sentiment neutral and prompt consolidation beneath strong resistance at 1.3600/30.
I,Mike Macdonald, the Senior Technical Strategist declare that the views expressed herein are mine and are clear, fair and not misleading at the time of publication. They have not been influenced by any relationship, either a personal relationship of mine or a relationship of the firm, to any entity described or referred to herein nor to any client of Continuum Economics nor has any inducement been received in relation to those views. I further declare that in the preparation and publication of this report I have at all times followed all relevant Continuum Economics compliance protocols including those reasonably seeking to prevent the receipt or misuse of material non-public information.